
|
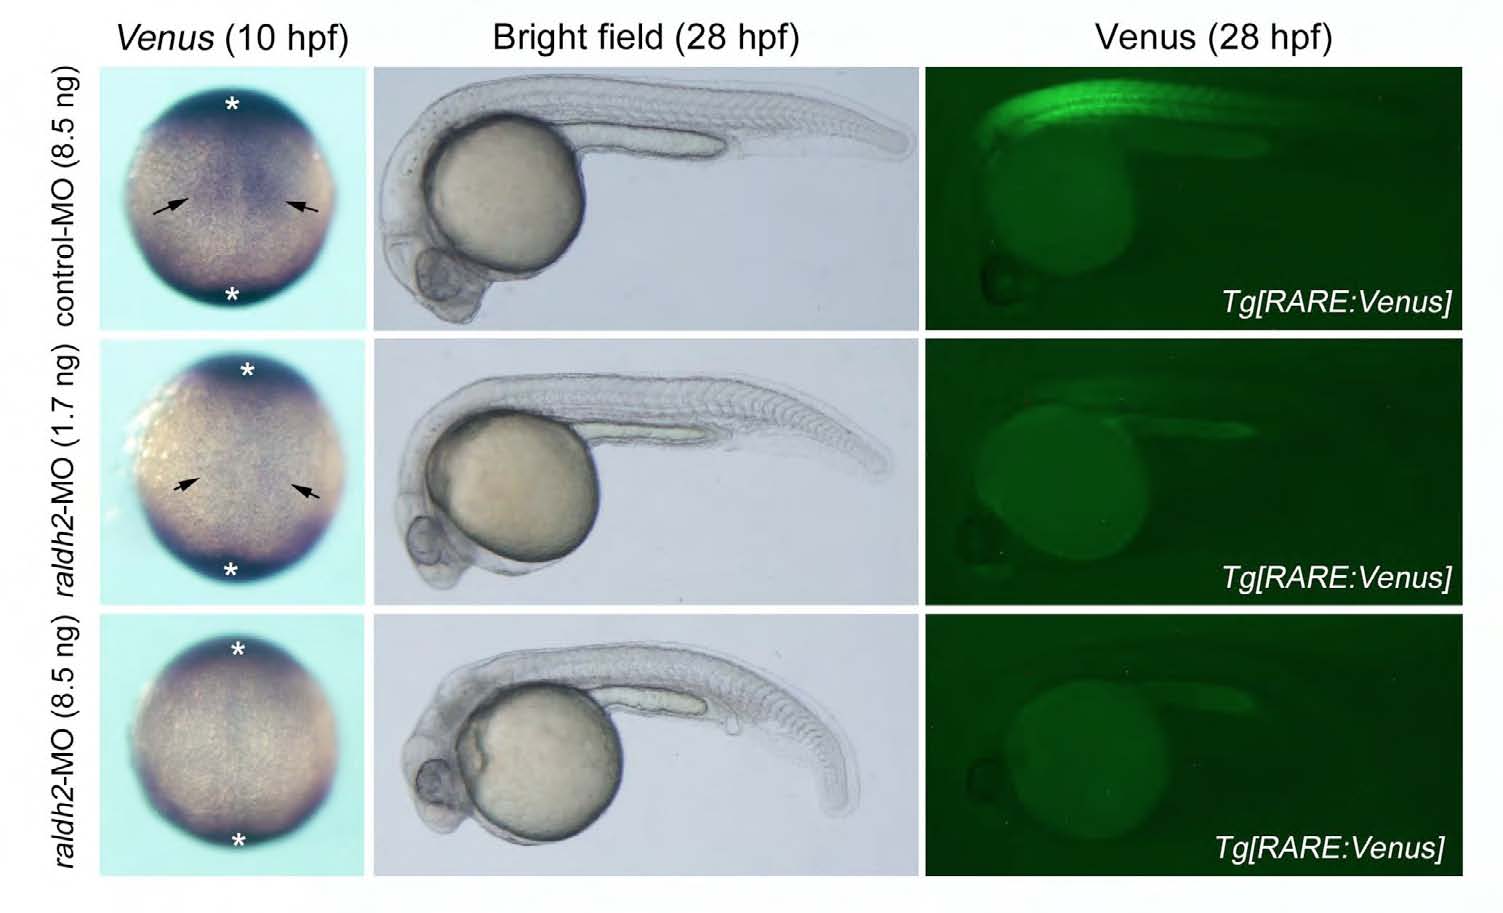
Fig. S2 Knockdown efficiency of raldh2 evaluated by using Tg[RARE:Venus] embryos. Left panel: Representative images of Venus expression in 10 hpf embryos injected with 8.5 ng control-MO (n = 42), 1.7 ng raldh2-MO (n = 34) or 8.5 ng raldh2-MO (n = 38). Dorsal view, anterior to the top. in situ signal marked by asterisk was considered as a background signal because similar signal could be detected in wildtype embryos and because raldh2 is not expressed in these regions. Center and right panel: Representative images of Venus expression in 28 hpf embryos injected with 8.5 ng control-MO (n = 57), 1.7 ng raldh2-MO (n = 34) or 8.5 ng raldh2- MO (n = 41). Lateral view, anterior to the left. RA signal activity (Venus signals) could be seen at a part of paraxial mesoderm (arrow) in control embryos at 10 hpf, and at anterior somites and eyes in control embryos at 28 hpf (upper panels). The activity was detected weakly in embryos injected with 1.7 ng raldh2-MO (middle panels), but not in embryos injected with 8.5 ng raldh2-MO (lower panels).