
Fig. 6
- ID
- ZDB-IMAGE-140325-48
- Genes
- Publication
- Wylie et al., 2014 - Post-transcriptional regulation of wnt8a is essential to zebrafish axis development
- All Figures
- Figures for Wylie et al., 2014
|
Fig. 6
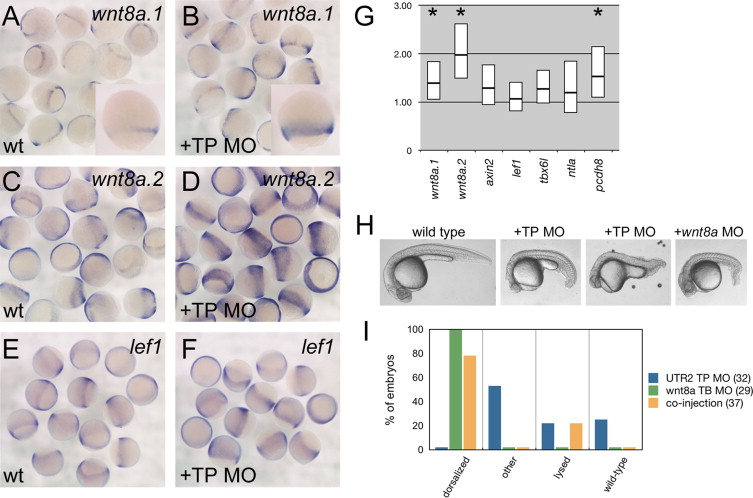
UTR2 TP MO elevates wnt8a levels. (A–F) In situ hybridizations, 60–80% epiboly. Probe indicated in upper right, relative probe position is shown in Fig. 1. (A, C, and E) Control morpholino injected. (B,D,F) UTR2 TP MO injected. Note increased staining for wnt8a.1 and wnt8a.2. Insets in A and B: Close-up comparison to highlight differences in wnt8a.1. (G) RT-qPCR quantification of expression changes. Y-axis indicates fold change from levels in control injected embryos. Box indicates ±standard deviation, line in box represents mean. Asterisks indicate p<0.01. (H) Lateral views of live 24 hpf embryos. Treatment indicated above each image. (I) Percent of embryos per class after morpholino co-injection. Number in parentheses=n for each treatment.
Reprinted from Developmental Biology, 386(1), Wylie, A.D., Fleming, J.A., Whitener, A.E., and Lekven, A.C., Post-transcriptional regulation of wnt8a is essential to zebrafish axis development, 53-63, Copyright (2014) with permission from Elsevier. Full text @ Dev. Biol.