
IMAGE
Fig. 4
- ID
- ZDB-IMAGE-140325-46
- Publication
- Wylie et al., 2014 - Post-transcriptional regulation of wnt8a is essential to zebrafish axis development
- All Figures
- Figures for Wylie et al., 2014
Image
|
Figure Caption
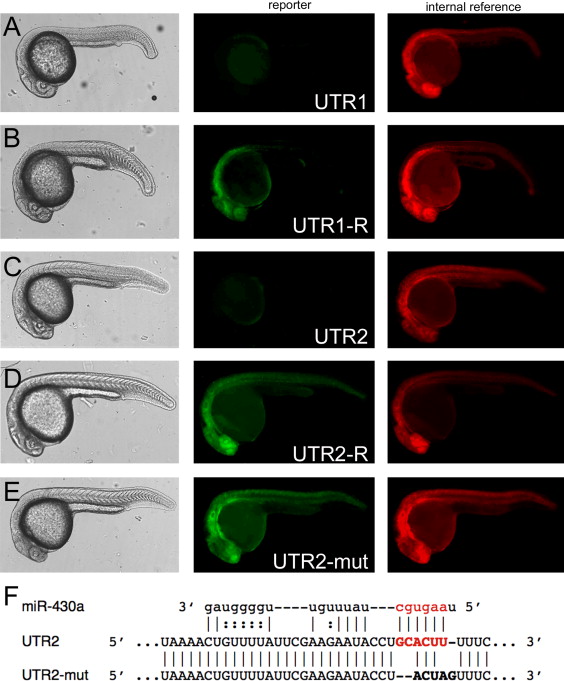
Fig. 4
UTR1 and UTR2 suppress gene expression in transient assays. (A–E) Left column: live embryos at 24 hpf, lateral views. Middle column: corresponding images of EGFP fluorescence. Right column: corresponding images of control mRFP fluorescence. UTR element present in the EGFP reporter transcript is indicated in the middle column. (F) Portion of UTR2, UTR2-mut and potential alignment to miR-430a. The miR-430 seed and seed complement are in red.
Acknowledgments
This image is the copyrighted work of the attributed author or publisher, and
ZFIN has permission only to display this image to its users.
Additional permissions should be obtained from the applicable author or publisher of the image.
Reprinted from Developmental Biology, 386(1), Wylie, A.D., Fleming, J.A., Whitener, A.E., and Lekven, A.C., Post-transcriptional regulation of wnt8a is essential to zebrafish axis development, 53-63, Copyright (2014) with permission from Elsevier. Full text @ Dev. Biol.