
Image
|
Figure Caption
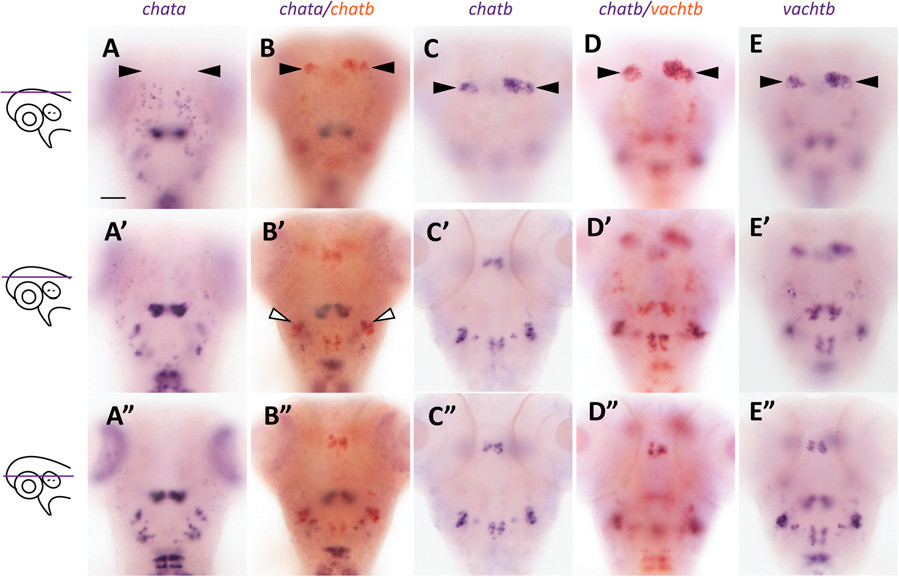
Fig. S2
Coexpression of chatb with chata and vachtb. Single and double ISH for chata (A–A22), chata/chatb (B–B22), chatb (C–C22), chatb/vachtb (D–D22), and vachtb (E–E22) in 4-d postfertilization (dpf) larvae, imaged at the designated focal plane (at left). (A–E) Arrowheads mark the Hb. (B2) White arrowheads indicate chata and chatb coexpression in hindbrain neurons. (Scale bar: 50 μm.)
Figure Data
Acknowledgments
This image is the copyrighted work of the attributed author or publisher, and
ZFIN has permission only to display this image to its users.
Additional permissions should be obtained from the applicable author or publisher of the image.
Full text @ Proc. Natl. Acad. Sci. USA