
IMAGE
Fig. S3
- ID
- ZDB-IMAGE-140324-33
- Publication
- Weber et al., 2013 - Characterization of light lesion paradigms and optical coherence tomography as tools to study adult retina regeneration in zebrafish
- All Figures
- Figures for Weber et al., 2013
Image
|
Figure Caption
Fig. S3
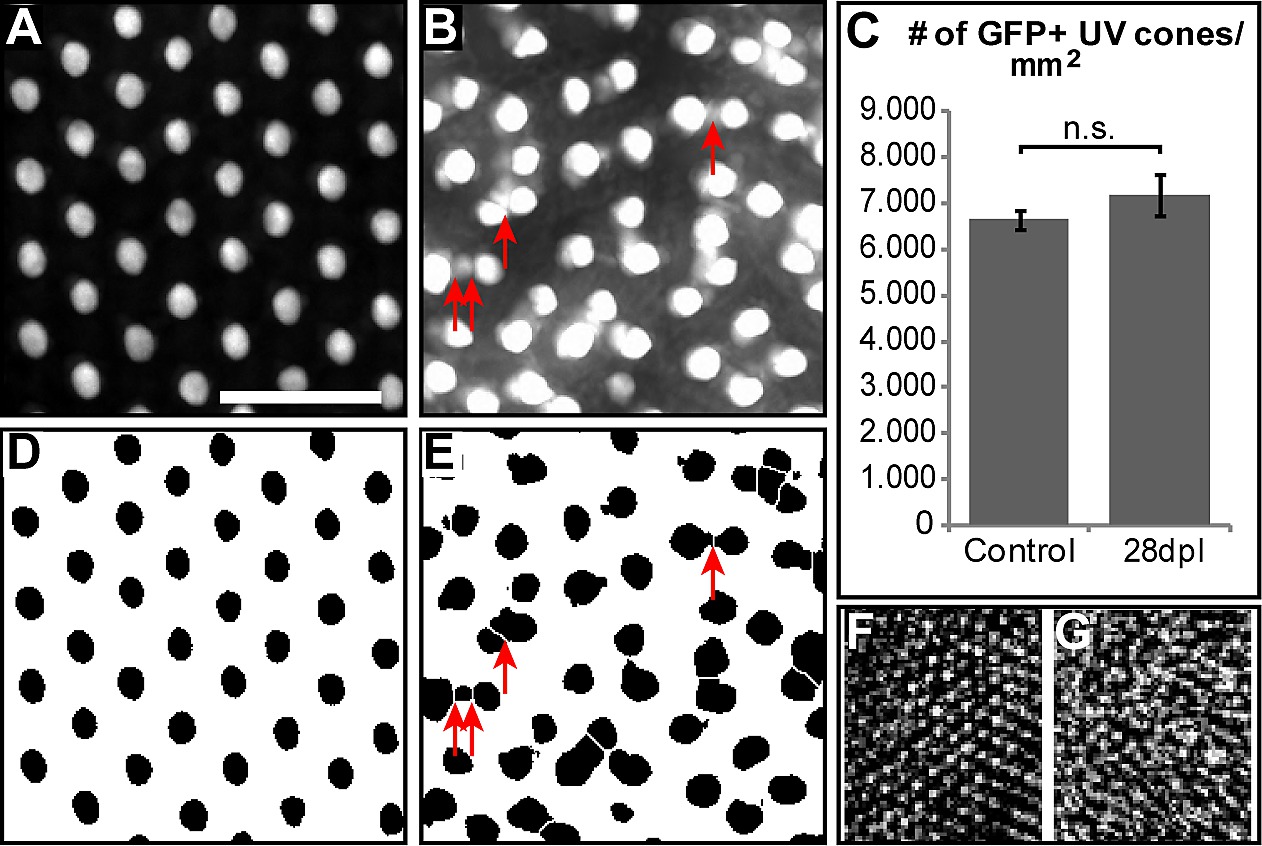
Changes in UV cone mosaic after regeneration in light lesions. A: Close-up image of untreated control retina flatmount from opn1sw1:GFP fish. B: Close up image of regenerated retina (28 dpl) from the same line. C: Quantification of UV cones per area compared (n = 6; p = 0.28; error bars indicate SEM). D, E: Same as A, B after image modification in order to count the number of cones automatically with Fiji software. Scale bar represents 20 μm. F, G. In vivo image of UV cones from OCT Data before (F) and at 28 dpl after light lesion (G) from the same fish.
Acknowledgments
This image is the copyrighted work of the attributed author or publisher, and
ZFIN has permission only to display this image to its users.
Additional permissions should be obtained from the applicable author or publisher of the image.
Full text @ PLoS One