
Image
|
Figure Caption
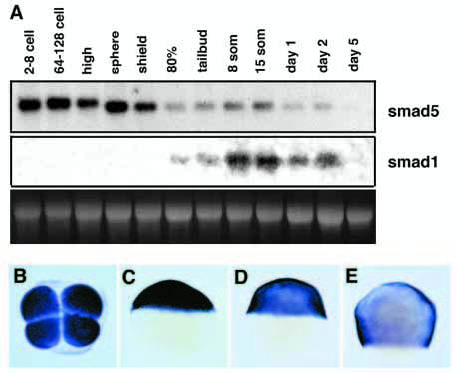
Fig. 2 Expression of smad5 and smad1. (A) Developmental northern analysis with 10 μg of total RNA of the indicated stages, hybridized with a smad5- (upper panel) and a smad1- (middle panel) specific probe. Lower panel shows ethidium bromide staining of 28S rRNA as loading control. (B-H) Whole-mount in situ hybridization using a smad5-specific probe. (B) 4-cell stage, animal view. (C) Sphere stage, lateral view. (D) Shield stage, lateral view, dorsal right. (F) 80% epiboly, lateral view, dorsal right.
Figure Data
Acknowledgments
This image is the copyrighted work of the attributed author or publisher, and
ZFIN has permission only to display this image to its users.
Additional permissions should be obtained from the applicable author or publisher of the image.
Full text @ Development