
|
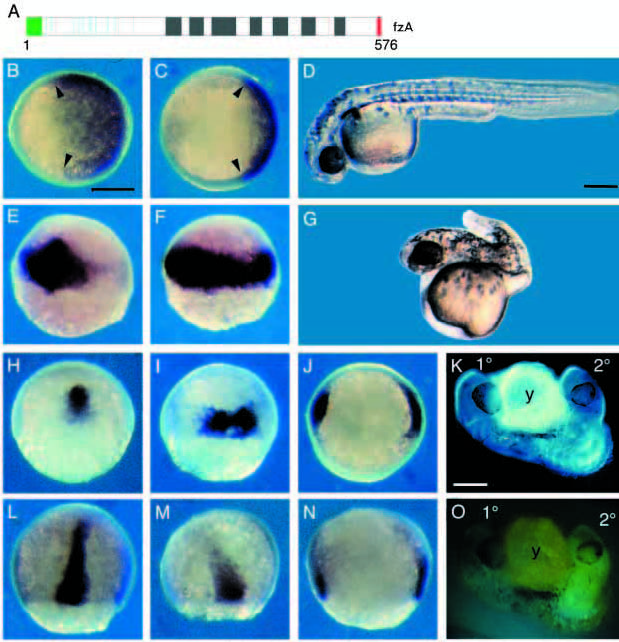
Fig. 2 Misexpression of fz hyperdorsalizes zebrafish embryos. (A) Representation of fzA protein, as designated in Fig. 1A. B,E,H and L show comparably staged control embryos. C,F,I,J,M and N show fzA mRNA-injected embryos, stained in situ. (B,C) Animal pole view of shield stage embryos stained for GATA-2 (Detrich et al., 1995). The stained region is reduced in fzA-injected embryo. (E,F) Dorsal view of shield stage embryos stained for chordin (Schulter-Merker et al., 1997; Miller- Bertoglio et al, 1997). chordin expression is expanded in the injected embryo. (H,I) Dorsal view of 60% epiboly stage embryos stained for goosecoid (Stachel et al., 1993) which is expanded in the injected embryo. (J) Animal pole view of the same stage injected embryo stained for goosecoid. Note two stained regions corresponding to endogenous and ectopic shields. (L,M) Dorsal view of 75% epiboly embryos stained for the axial mesoderm marker sonic hedgehog (Krauss et al., 1993; Ekker et al., 1995). Note that staining is reduced in the fzAinjected embryo. (N) Lateral view of an embryo displaying ectopic axial structures, as visualized by sonic hedgehog staining. (D) 28 hour control and (G) fzA-injected embryo. Note reduced trunk and tail structures. (K) Lateral view of an ectopic axis generated as a result of HFZ5 misexpression. The primary (1°) axis is distinguished from the induced (2°) axis by the inheritance of the tracer GFP mRNA, as visualized by fluorescence (O) of the same living embryo. Scale bars, 250 μm.