
|
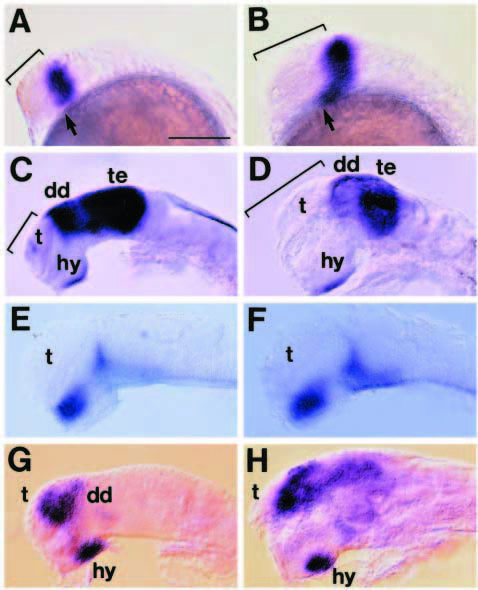
Fig. 8 Effects of six3 overexpression on expression patterns of brain subregion-specific genes. Globin (A,C,E,G) or six3 mRNA-injected (B,D,F,H) embryos. (A,B) Lateral views of lim5 expression at the 16- somite stage. The rostral lim5-negative region (bracket) expands in six3 mRNA-injected embryos. The apparent posterior displacement of ventral lim5-positive cells (arrows) is smaller than that of dorsal cells. (C,D) Lateral views of otx2 expression at 29 hours. The rostral otx2-negative region (bracket) is enlarged in six3 mRNA-injected embryos, while the otx2 mRNA-expressing region moves posteriorly and becomes shorter. (E,F) Lateral views of shh expression at 24 hours; shh expression is not changed substantially. (G,H) Lateral views of emx2 expression at 24 hours. The emx2-positive region in the telencephalon, but not in the hypothalamus, is enlarged. Scale bar, 200 μm.