
|
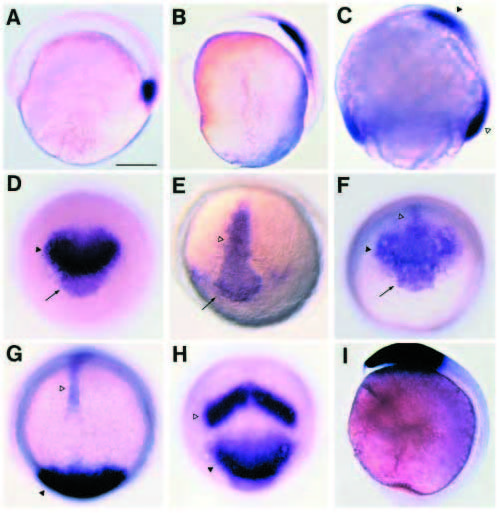
Fig. 2 Expression of six3 in early embryogenesis. (A-C,I) Lateral views with dorsal to the right; (D-H), dorsoanterior views with posterior to the top. (A) 55% epiboly; six3 starts being expressed in the hypoblast of the embryonic shield. (B) 75% epiboly; six3 signal is localized in the anterior axial mesendoderm. (C) 80% epiboly; embryo was hybridized with six3 and ntl probes together using the same color; six3 is expressed only in the anterior (black triangle), whereas ntl is expressed posteriorly (open triangle). (D-H) Tail bud stage; embryos were hybridized with six3 (D), gsc (E), six3+gsc (F), six3+ntl (G), six3+pax2 (H), using the same color. (D-F) six3 is expressed in ectodermal cells of the prospective forebrain (black triangle). six3 expression in the anterior axial mesendoderm is delimited to the polster (arrow), while gsc expression is posteriorly expanded (open triangle). (G) six3 is not expressed in the presumptive notochord; there is a gap between six3 (black triangle) and ntl (open triangle) mRNA-expressing cells. (H) six3 is expressed in the prospective forebrain, indicated by a gap between six3 (black triangle) and pax2 (open triangle) mRNA-expressing cells. (I) Twosomite stage; six3 expression is sharply delimited to the rostral brain. Scale bar, 200 μm.