
Image
|
Figure Caption
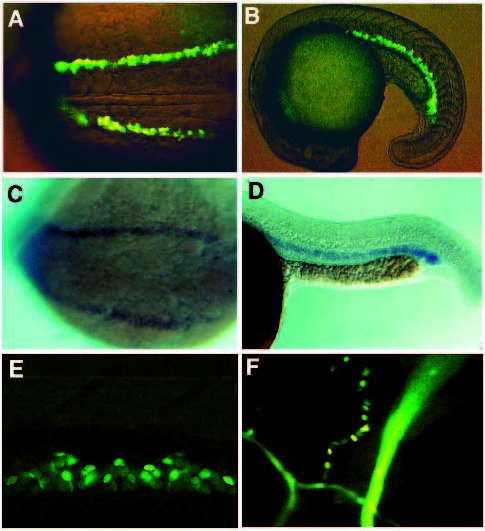
Fig. 3 Comparison of GATA-1 mRNA and GFP expression driven by the GATA-1 promoter in germline transgenic zebrafish. (A,B) GFP expression driven by the G1-GM2 construct in a 12 hour and a 22 hour transgenic zebrafish embryo, respectively. (C,D) GATA-1 mRNA detected by RNA in situ hybridization in a 12 hour and a 24 hour zebrafish embryo, respectively. (E) GFP expression in circulating blood cells in the ventral axial vein of a 3-day-old transgenic embryo. (F) GFP expression in circulating blood cells of an adult transgenic zebrafish.
Figure Data
Acknowledgments
This image is the copyrighted work of the attributed author or publisher, and
ZFIN has permission only to display this image to its users.
Additional permissions should be obtained from the applicable author or publisher of the image.
Full text @ Development