
|
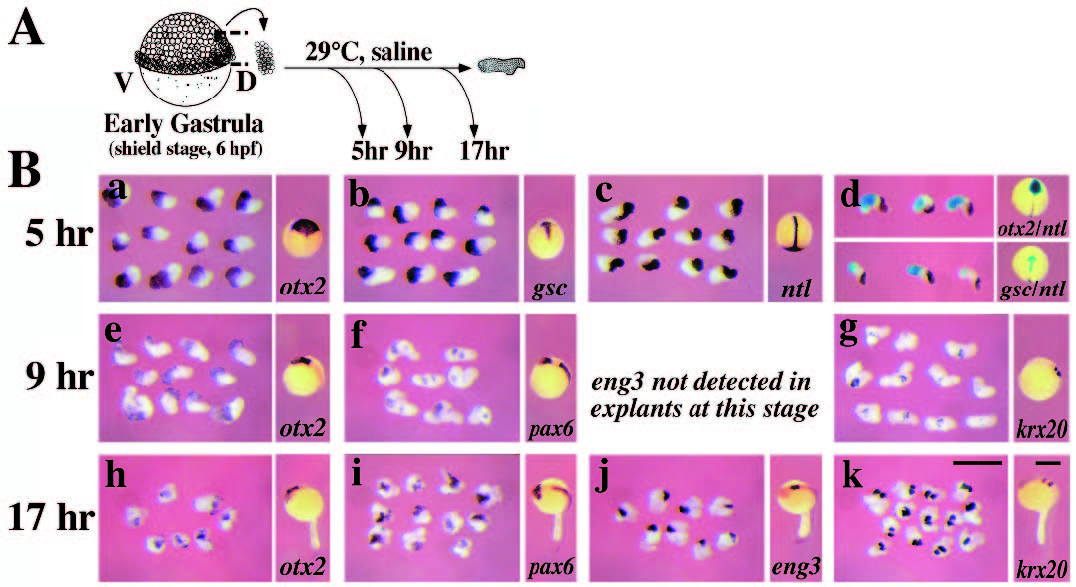
Fig. 3 Cultured shields display an anteroposterior arrangement of mesodermal and neural gene expression. (A) Schematic representation of shield dissection and culture. Explants were taken from shield stage embryos (early gastrula, 6 hpf), cultured individually and harvested when control embryos reached the end of gastrulation (10 hpf, 5 hours in culture), the 12 somite stage (15 hpf, 9 hours in culture) or the end of somitogenesis (24 hpf, 17 hours in culture). V,ventral; D, dorsal. (B) Whole-mount in situ hybridization analysis of mesodermal and neural gene expression in explanted shields and whole embryos. After 5 hours in culture, explants (left panel for each marker) and control embryos (right panel) were assayed for expression of otx2 (a), gsc (b), ntl (c) as well as otx2/ntl and gsc/ntl (d; by double in situ hybridization with otx2 (upper panel) or gsc (lower panel) in light blue and ntl in purple). Shields and embryos harvested after 9 hours of culture were assayed for expression of otx2 (e), pax6 (f) and krx20 (g). After 17 hours in culture shields and explants were further assayed for expression of otx2 (h), pax6 (i), eng3 (j) and krx20 (k). The scale bars in (k) are 400 μm. Control embryos are arranged with the anterior up except in d where the embryos are tilted to show the gap in staining between anterior and posterior markers. a-d are dorsal views and e-k are lateral views. (C) Anteroposterior alignment of neural gene expression in cultured shields. Explants hybridized with otx2 (a), pax6 (b) and krx20 (c) after 9 hours in culture were aligned with the posterior knob (arrows, see text) to the right. Each expression domain is indicated with an arrowhead. The relative anteroposterior position of each marker was calculated by determining the distance between the posterior end of the explant and the center of the staining. This distance was expressed as a fraction of the total length of the explant and plotted on the schematic in d. The posterior knob corresponds to an A/P position of ‘0’ and the anterior end to an A/P position of ‘1’. Red dots in d correspond to otx2 expression, blue to anterior pax6, green to krx20, and black to posterior pax6 expression. Each dot represents data from an individual explant.