
|
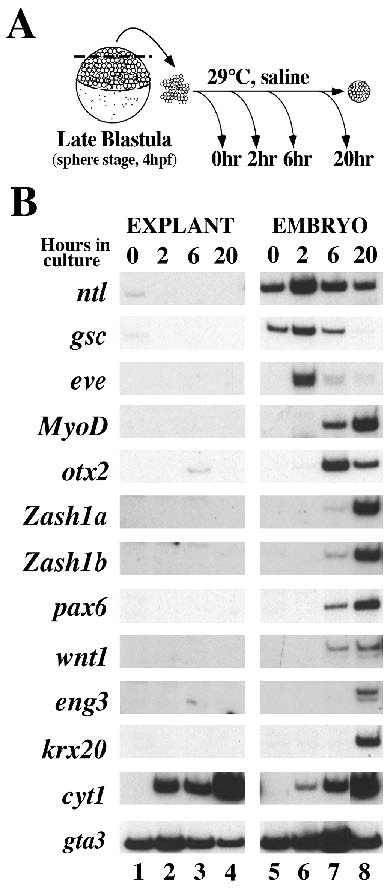
Fig. 2 Marker gene expression in cultured animal caps. (A) Schematic representation of animal cap dissection and culture. Animal caps were dissected from sphere stage embryos (late blastula, 4 hpf), aggregated into groups of 10 and harvested immediately after dissection or when control embryos reached the onset of gastrulation (6 hpf, 2 hours in culture), the end of gastrulation (10 hpf, 6 hours in culture) or the end of somitogenesis (24 hpf, 20 hours in culture). (B) RTPCR analysis of gene expression in explanted animal caps and whole embryos. Explants (lanes 1- 4) and whole embryos (lanes 5-8) were harvested at the time of dissection (lanes 1 and 5), or after 2 hours (lane 2 and 6), 6 hours (lanes 3 and 7) or 20 hours in culture (lane 4 and 8) and analyzed for expression of the mesodermal markers ntl (Schulte-Merker et al., 1992), gsc (Stachel et al., 1993; Schulte-Merker et al., 1994a; Thisse et al., 1994), eve (Joly et al., 1993) and MyoD (Weinberg et al., 1996), the anterior marker otx2 (Li et al., 1994), the neural markers zash1a (Allende and Weinberg, 1994), zash1b (Allende and Weinberg, 1994), pax6 (Krauss et al., 1991; Puschel et al., 1992), wnt1 (Molven et al., 1991), eng3 (Ekker et al., 1992), krx20 (Oxtoby and Jowett, 1993), the type I cytokeratin cyt1 (Sagerström and Sive, unpublished data) and the ventral marker gta3 (Neave et al., 1995) by relative quantitative RT-PCR as described in Materials and Methods. Relative quantitation enables comparison of the expression of one gene in different samples, e.g. comparison of cyt1 in caps and embryos. However, since the efficiency of amplification varies between primer pairs, it is not possible to compare the levels of two different genes. The data shown for each gene is representative of 3-6 independent experiments. The ntl and gsc signals detected in explants at the time of dissection (lane 1) represent less than 5% of the signal in whole embryos. otx2 expression in 6 hour explants (lane 3) averaged about 10% of the expression in whole embryos (see also in situ hybridization in Figs 2C and 5B). (C) Whole-mount in situ hybridization analysis of gene expression in animal cap explants. Each explant shown is an aggregate of 10 animal caps (see Materials and Methods). Explants were analyzed for the expression of gsc (a), ntl (b), pax6 (c), otx2 (d), cyt1 (e) and gta3 (f). A 5 mm section through a cyt1-stained explant (g) shows expression primarily at the surface whereas a section through a gta3 stained explant (h) shows internal expression. The internal staining in g (indicated by an arrow) may surround two cavities. The explants in a were harvested after 2 hours in culture, the explants in d after 6 hours in culture and the explants in b, c, e and f after 20 hours in culture.