
|
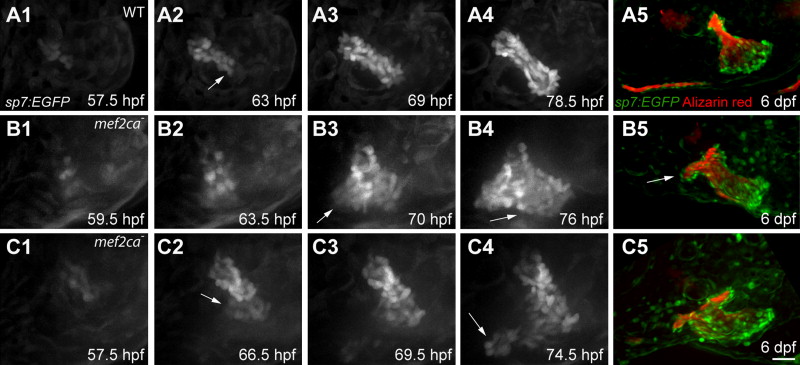
Fig. 7
Differences in position and timing of ectopic osteoblast appearance and outgrowth explains skeletal phenotypic variation. (A1–C4) Confocal projections from time lapse recordings starting at 55 hpf. sp7:EGFP labeling. (A5–C5) The same larvae at 6 dpf, bone matrix counterstained with Alizarin Red. (A) In the wild type a small collective of sp7:EGFP-expressing osteoblasts emerge (A1), and then osteoblasts are newly recruited at the posterior-ventral apex (A2, arrow) to expand the bone linearly (A2–A4). (B) A mef2ca mutant in which ectopic osteoblasts are added to the anterior side of the Op axis (B2). The outgrowth expands with new osteoblast addition in both the orthogonal (B3, arrow) and parallel pattern (B4, arrow). At 6 dpf the Op appears duplicated; a BR is absent (B5). (C) A mef2ca mutant in which two groups of ectopic osteoblasts arise (C2 and C4, arrows) and then merge. At 6 dpf the Op has a short spur, and appears duplicated. Scale bar 25 μm (A1–C4) and 50 μm (A5–C5).
Reprinted from Developmental Biology, 385(2), Delaurier, A., Huycke, T.R., Nichols, J.T., Swartz, M.E., Larsen, A., Walker, C., Dowd, J., Pan, L., Moens, C.B., and Kimmel, C.B., Role of mef2ca in developmental buffering of the zebrafish larval hyoid dermal skeleton, 189-99, Copyright (2014) with permission from Elsevier. Full text @ Dev. Biol.