
|
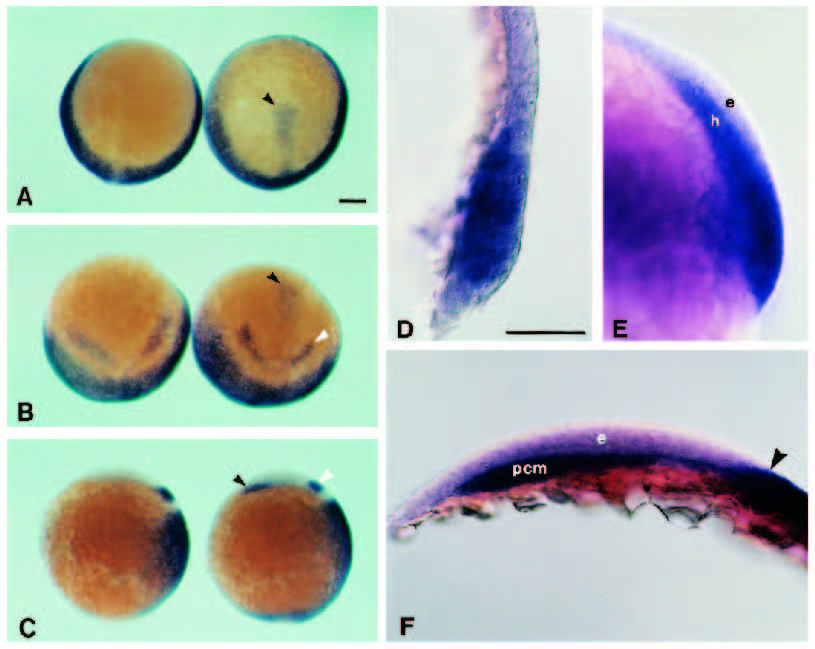
Fig. 4 Retinoic acid causes the ectopic expression of Hoxa-1. (A-C) Pairs of embryos that have hybridised to probes to Hoxa-1 and pax 2 under indentical conditions. The embryos on the right of each pair have been treated with RA on the onset of gastrulation. At this dose of RA, Hoxa-1 is ectopically expressed by 70% epiboly (A) in the axial midline (black arrow) and around the germ ring as seen from the animal pole. By the 1-somite stage (B - tilted animal pole view) pax 2 (white arrow) is first expressed in the prospective midbrain and, by this stage, the rostral limit of the Hoxa-1 signal in the treated embryos is no further anterior than in the control. A small patch of ectopically expressed Hoxa-1 lies anteriorly (black arrow). (C) The same embryo as seen in B but viewed laterally with anterior to the top and dorsal to the right. The white arrow indicates the normal pax 2 expression and the black arrow the ectopic Hoxa-1 expression which is in the prechordal mesoderm. (D-F) A series of high power views of optical sections through the midline of treated embryos showing ectopic expression of Hoxa-1 only in the hypoblast. (D) Ectopic expression is evident at the late shield stage. (E) Ectopically expressing cells are seem to be in the hypoblast. (F) The same embryo as that shown in B and C. Ectopic expression is present in the prechordal mesoderm. The arrow indicates the anterior extent of the normal expression of Hoxa-1 in the ectoderm. pcm, prechordal mesoderm; h, hypoblast; e, ectoderm. Scale bar, 100 μm.