
|
Fig. S2
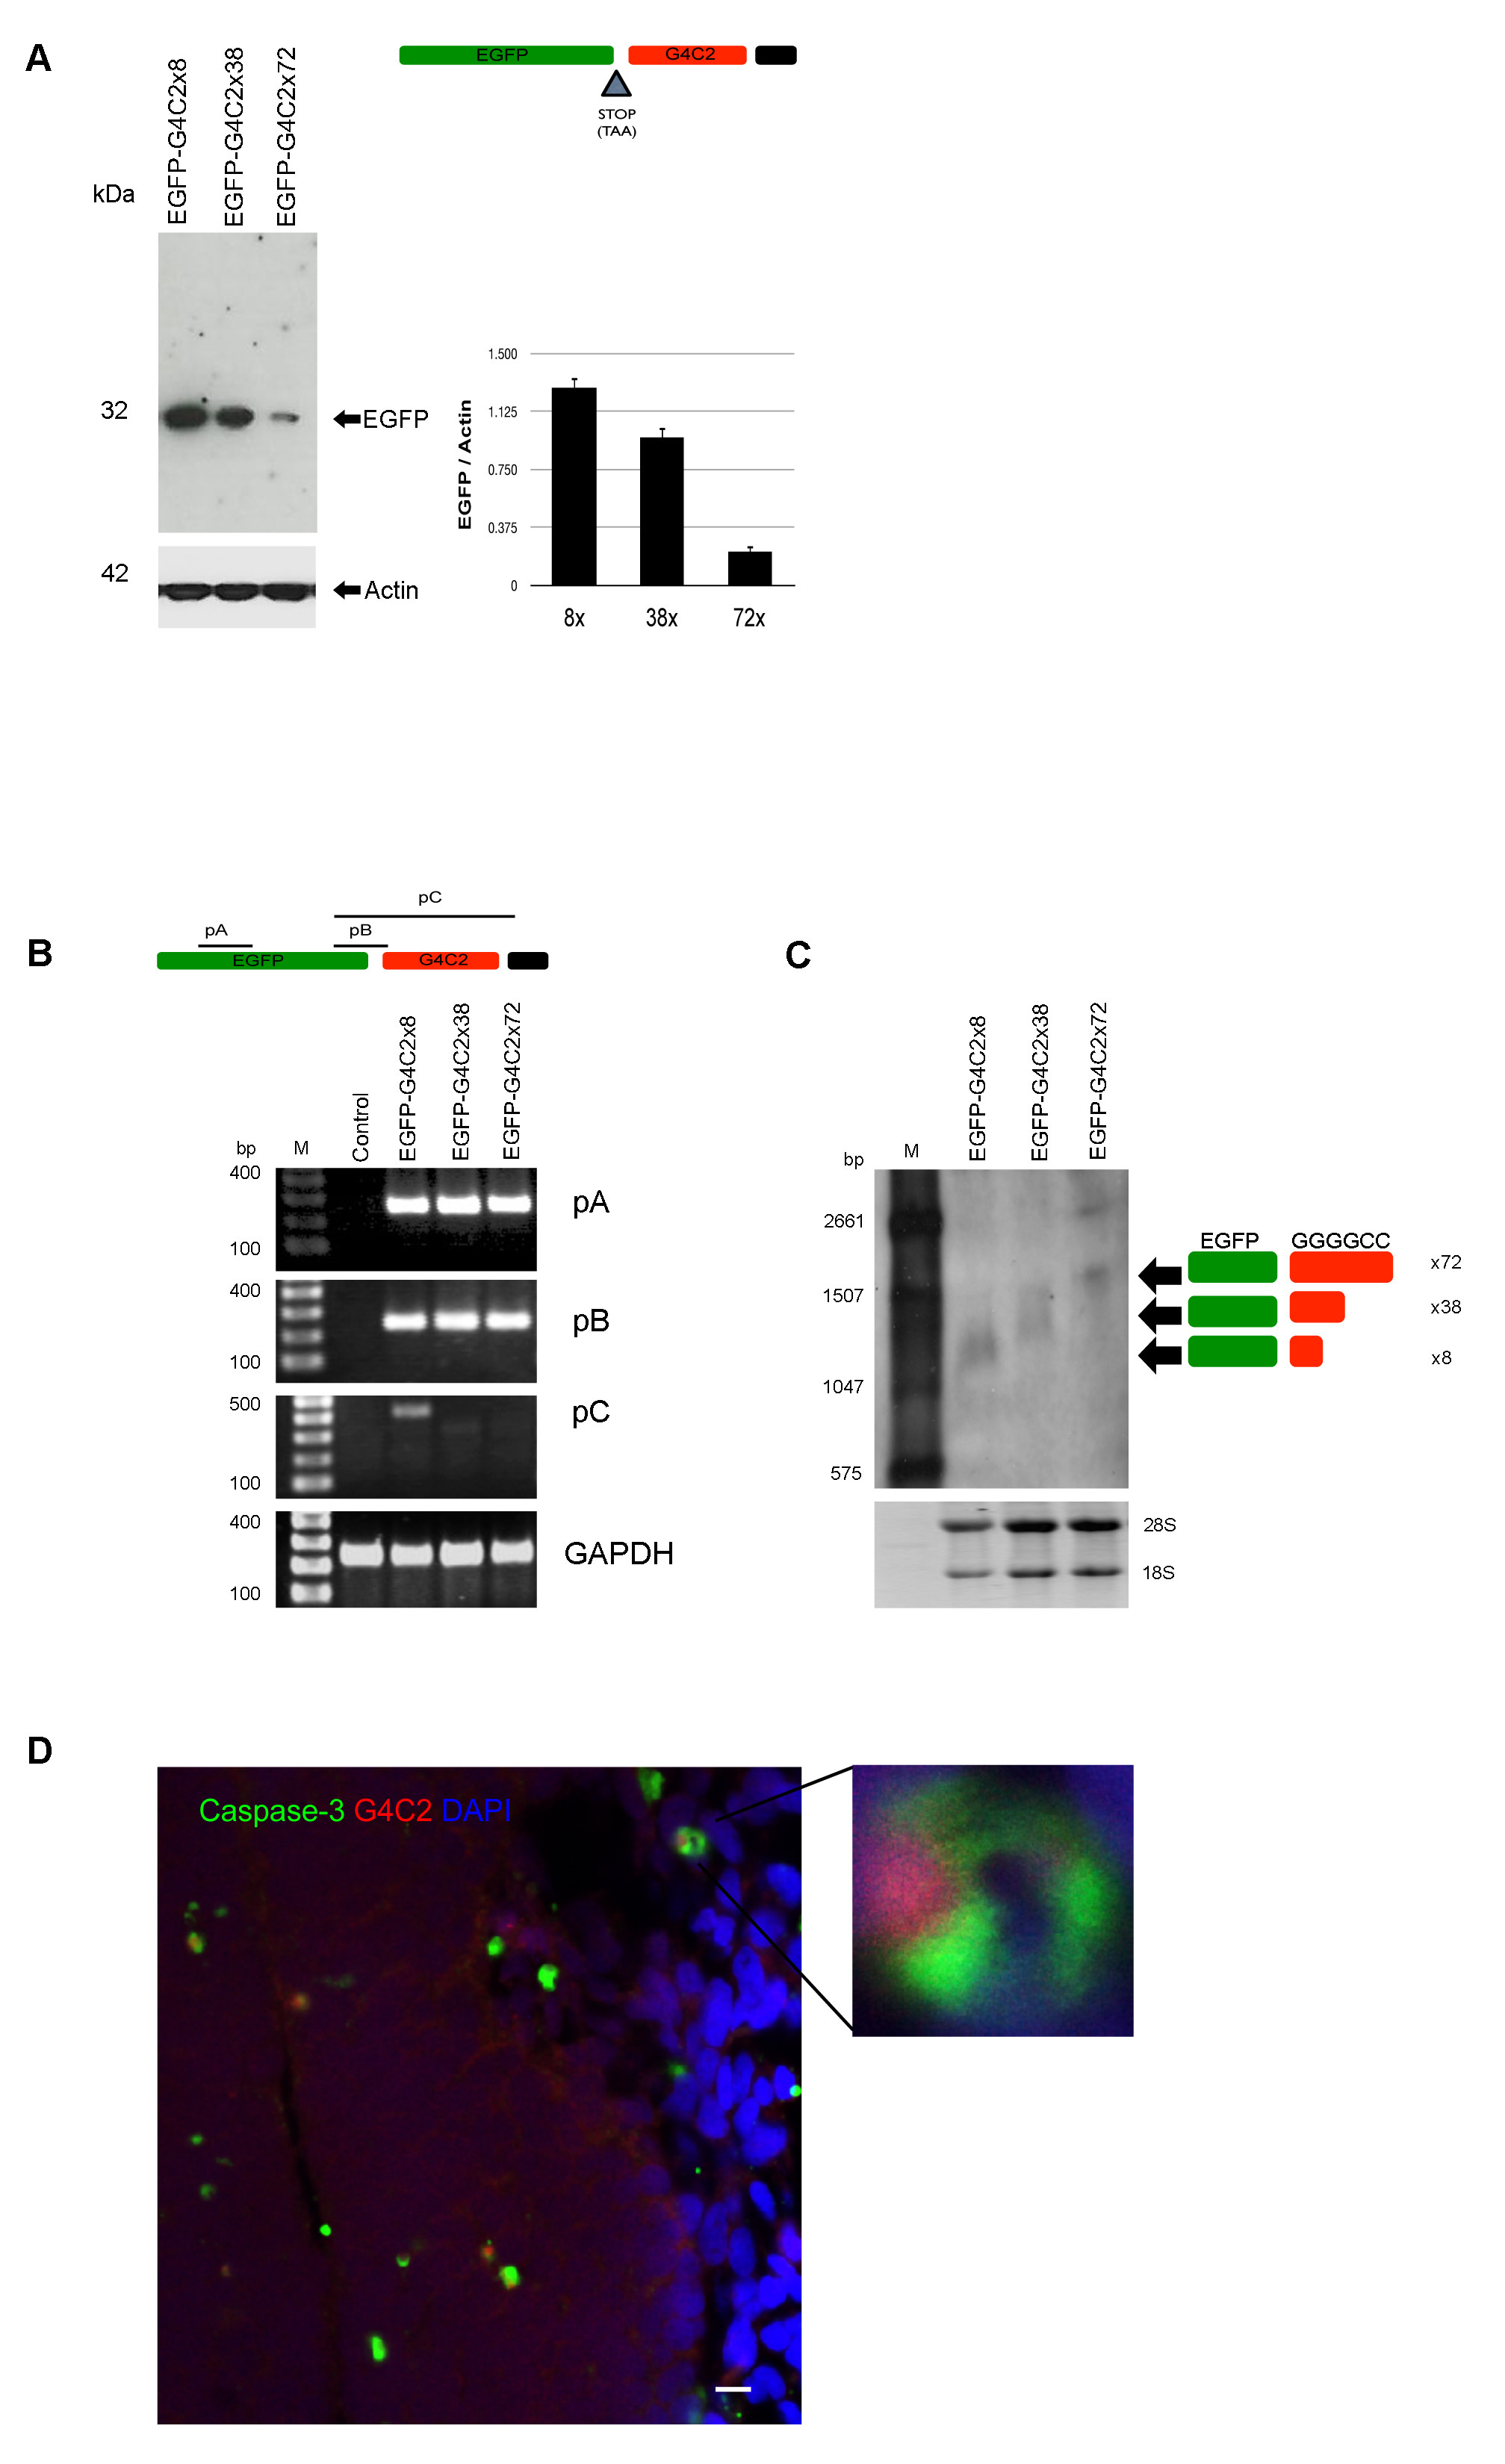
G4C2 repeat expansion decreased protein translation of EGFP but not mRNA level, related Figure 2
(A) We cloned the EGFP reporter gene into the 5′ to the G4C2 construct. Schematic diagram shows EGFP-G4C2 construct with a stop codon in between EGFP and G4C2. Westernblot shows that reduced EGFP translation of longer G4C2 transcripts is entirely consistent with size of 8x > 38x >72x repeats. (B) pA (primer A, amplify internal EGFP), pB (primer B, amplify between 3′ end EGFP and G4C2 ), pC (primer C, amplify full sequence G4C2). Semi-quantitative reverse transcriptase (RT)-PCR showed equal expression of mRNA from internal EGFP primer (pA) for G4C2x8, G4C2x32 and G4C2x72. There was no difference of internal EGFP sequence between EGFP-G4C2 x38 and EGFP-G4C2x72 (pB). In contrast, the amplification of G4C2 region (pC) showed no signal from EGFP-G4C2x38 and 72x except 8x. These data suggest that a hairpin structure of G4C2 may disturb polymerase and prevent further amplification. (C) mRNA extracted from plasmid transfected SH-SY5Y cells were used for Nothernblot, which shows the predicted size of the EGFP-G4C2 constructs. (D) G4C2 foci are detected in active caspase-3 positive cells from zebrafish. G4C2 RNA foci positive cells (white arrow) were observed in zebrafish cells (Green=active caspase-3, Red=G4C2, Blue=DAPI), scale bar = 10 μm.