
|
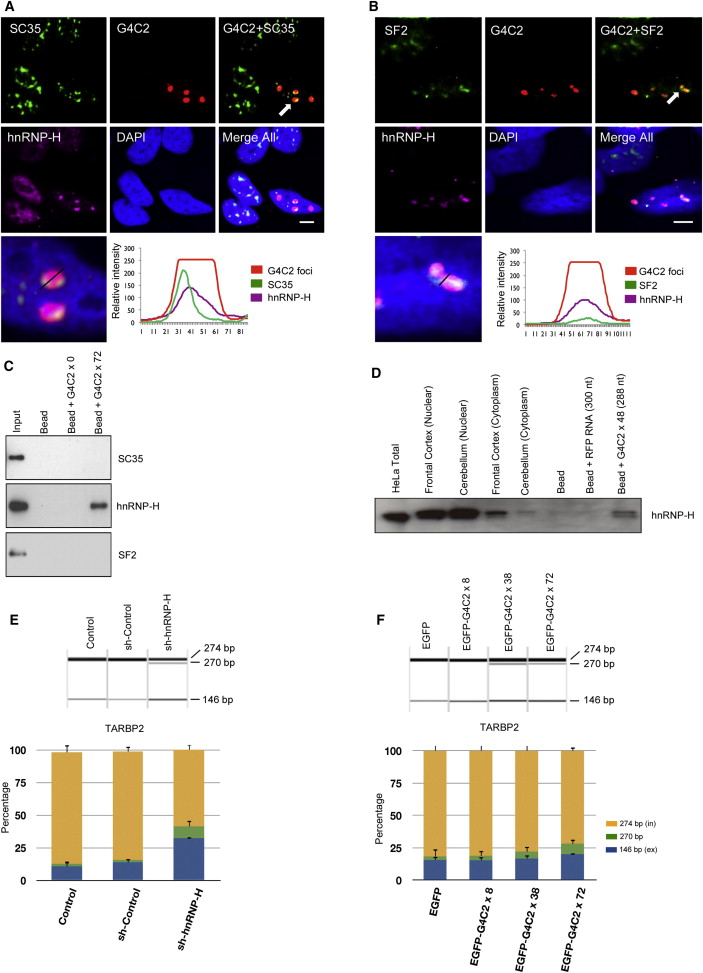
Fig. 3
SC35, SF2, and hnRNP-H Colocalize with G4C2 Nuclear Foci, but hnRNP-H Binds to G4C2 RNA Transcripts
(A–B) SH-SY5Y cells were transfected with a plasmid expressing 72× repeats and probed 24 hr after transfection for G4C2 by FISH and immunocytochemistry (ICC). (A and B) Endogenous SC35 (A) and SF2 (B) were detected by ICC using a Dylight-488-labeled secondary antibody. hnRNP-H was simultaneously detected by ICC, using a Dylight-649-labeled secondary antibody. The intensity of endogenous SC35, SF2, hnRNP-H, and G4C2 foci were analyzed by Leica line profile tools (scale bar represents 5 μm).
(C) Biotin-labeled G4C2×72 RNA transcripts were synthesized and used for RNA pull-down of SH-SH5Y lysates; G4C2×0 transcripts were used as control. Partial colocalization of SC35 and SF2 is seen with the RNA foci, whereas hnRNP-H shows very close colocalization. Only hnRNP-H coprecipitated with G4C2×72 RNA.
(D) Biotin aptamer-labeled G4C2×48 RNA transcripts were synthesized and used for RNA pull-down of rat brain lysates (Supplemental Experimental Procedures); RNA of equivalent length to G4C2×48 (300 nt) was used as a control. hnRNP-H coprecipitated with G4C2×48 RNA.
(E) Splicing assay of TARBP2 exon 7 shows that G4C2 RNA sequestration of hnRNP-H impairs RNA processing. Comparison of hnRNP H knockdown and control SH-SY5Y cells validates that hnRNP H promotes inclusion of TARBP2 exon 7.
(F) Analysis of TARBP2 exon 7 splicing in SH-SY5Y cells stably transfected with C9ORF72 repeats. Inclusion of TARBP2 exon 7 is decreased in cells expressing G4C2 ×72 but is not affected in cells expressing lower repeat numbers. PCR products including (in) or excluding (ex) the regulated alternative exon are marked on the right. Average quantification values of exon inclusion (yellow) and exclusion (blue) are shown. Error bars show SD of three replicates. To test significance, the ratio between exon 7 inclusion and exclusion was calculated and tested by one-way ANOVA and Tukey’s honestly significant difference test.
See also Figure S3