
Image
|
Figure Caption
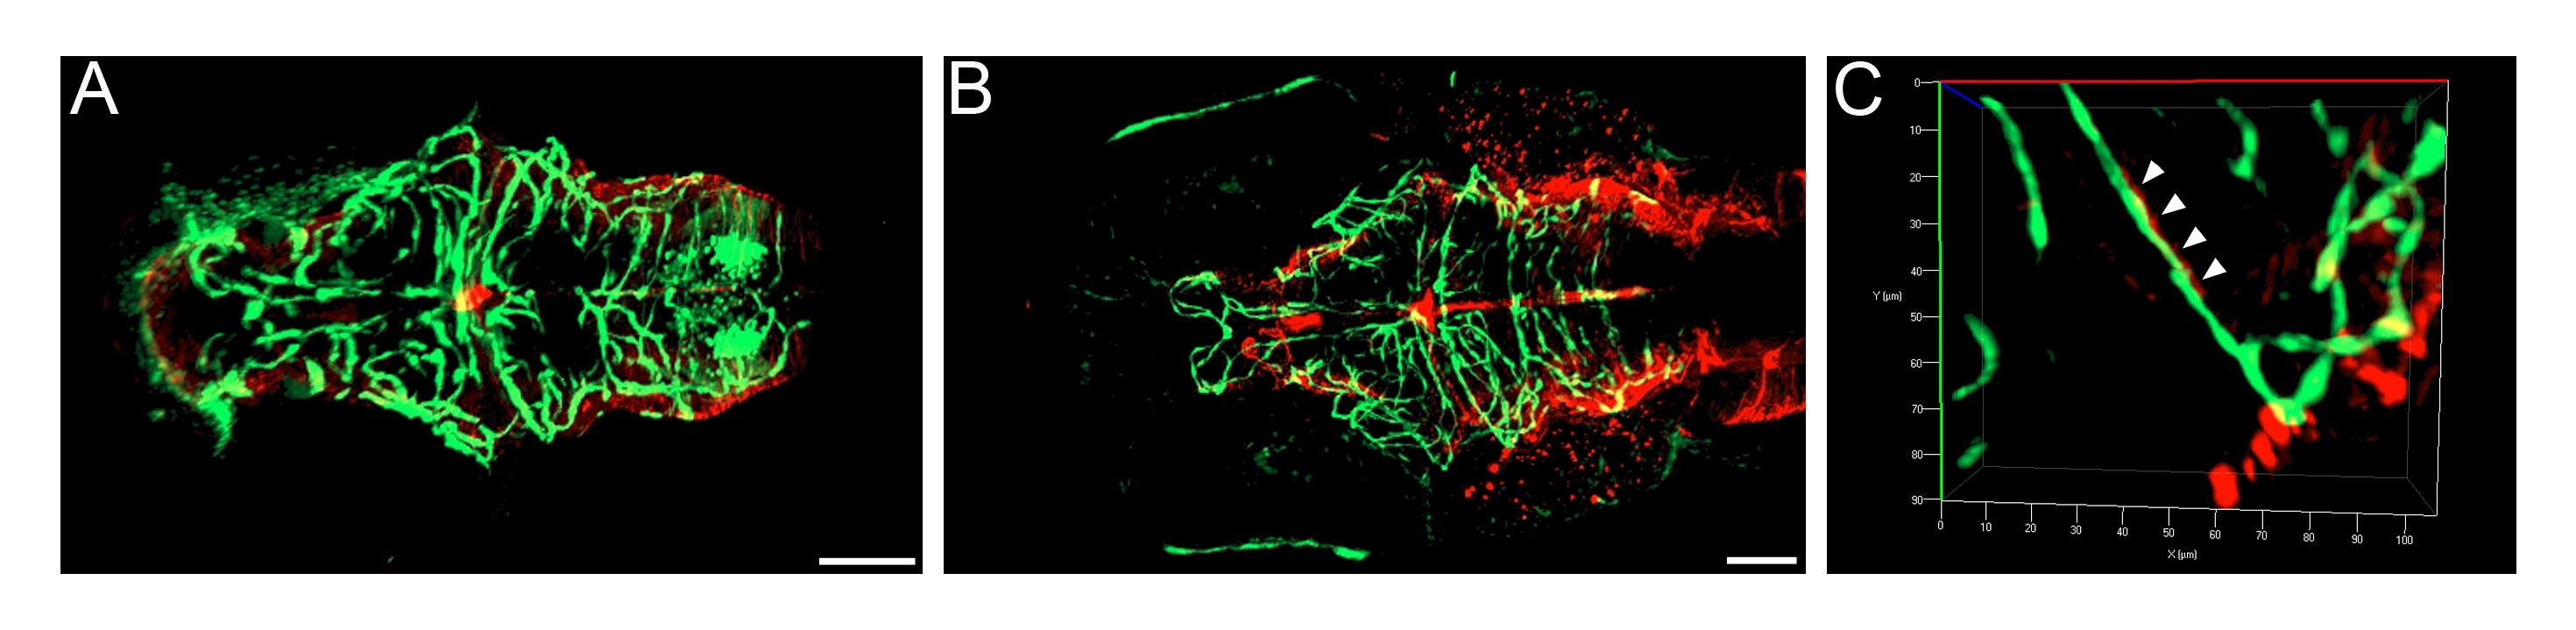
Fig. S3
Expression of GFAP around cerebral vessels. Maximum intensity projections of Tg(fli1a:EGFP)y1 transgenic larvae stained with GFAP antibody. A) At 7 d.p.f., GFAP staining is observed in the glia but does not co-localise with GFAP in the vasculature. B (low magnification) and C (high magnification) At 10 d.p.f., GFAP staining is observed in some cerebral vessels (arrowheads). Scale bar represents 50 μm.
Figure Data
Acknowledgments
This image is the copyrighted work of the attributed author or publisher, and
ZFIN has permission only to display this image to its users.
Additional permissions should be obtained from the applicable author or publisher of the image.
Full text @ PLoS One