
IMAGE
Fig. 3
Image
|
Figure Caption
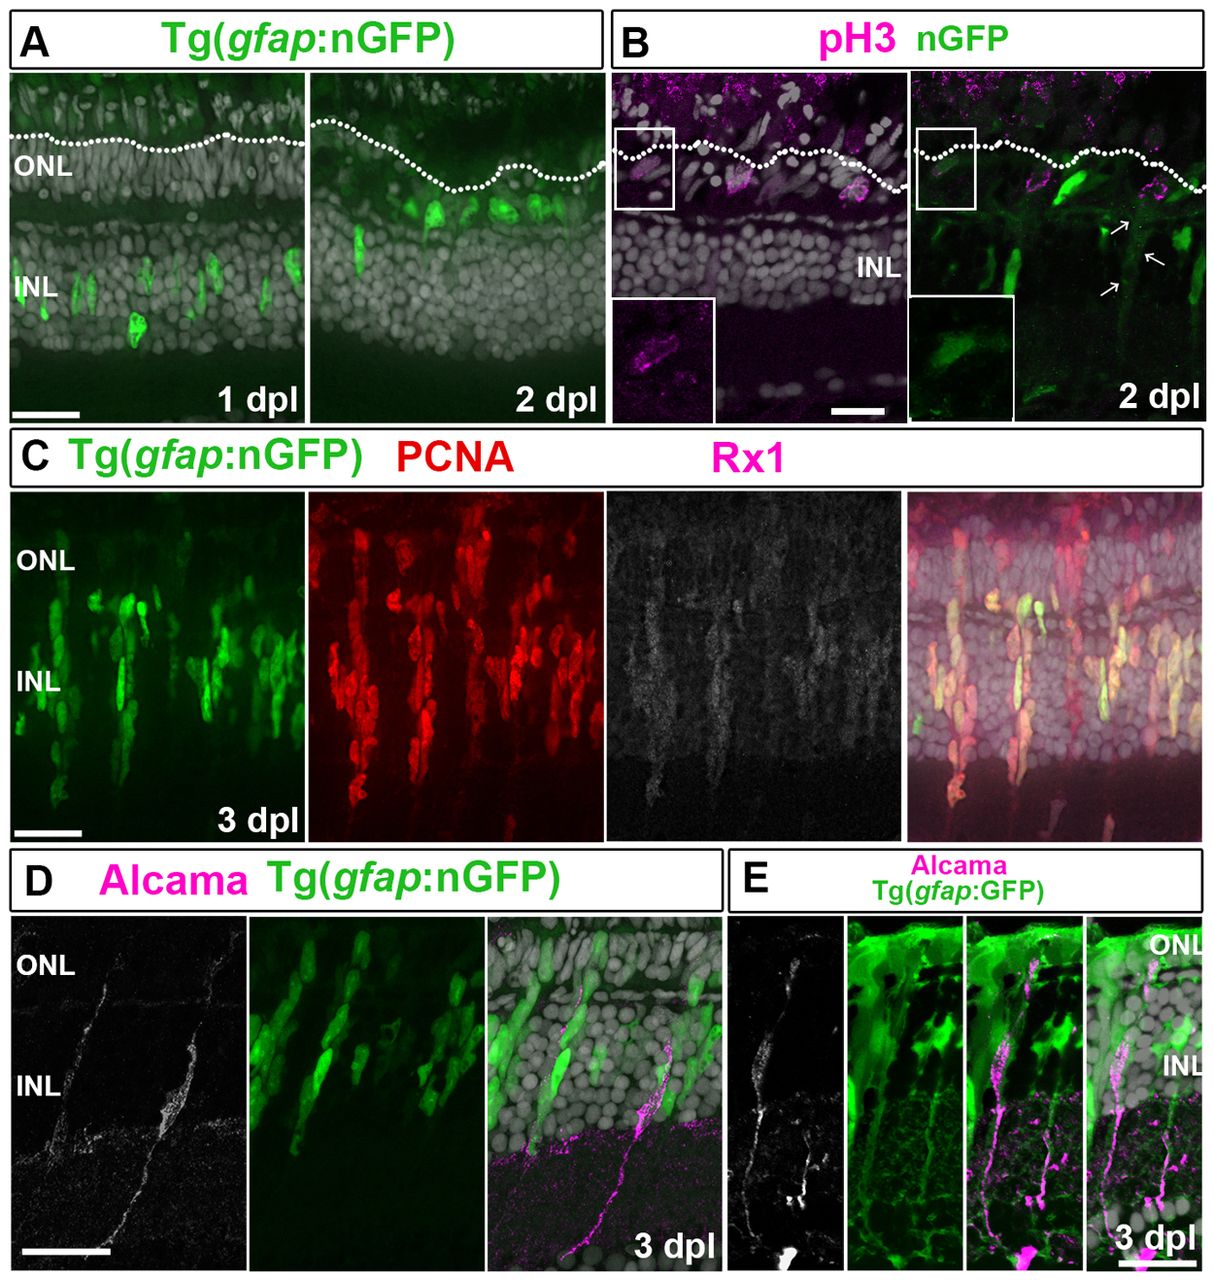
Fig. 3
Injury-induced Müller glia and retinal progenitors are distinct cell populations. (A) By 2 dpl, Müller glial nuclei (nGFP+, green) move to the OLM (dotted line). (B) nGFP+ (anti-GFP, green)/pH3+ (magenta) mitotic Müller glia nuclei at the OLM. nGFP is diffuse (arrows). Higher magnifications of the boxed regions are shown in insets. (C) nGFP+(green)/PCNA+ (red)/Rx1+ (white/magenta) progenitors at 3 dpl. (D) Alcama (white/magenta); nGFP. (E) Alcama (white/magenta) colocalizes with GFP. Scale bars: 20 μm (A,B,D,E); 5 μm (C).
Figure Data
Acknowledgments
This image is the copyrighted work of the attributed author or publisher, and
ZFIN has permission only to display this image to its users.
Additional permissions should be obtained from the applicable author or publisher of the image.
Full text @ Development