
|
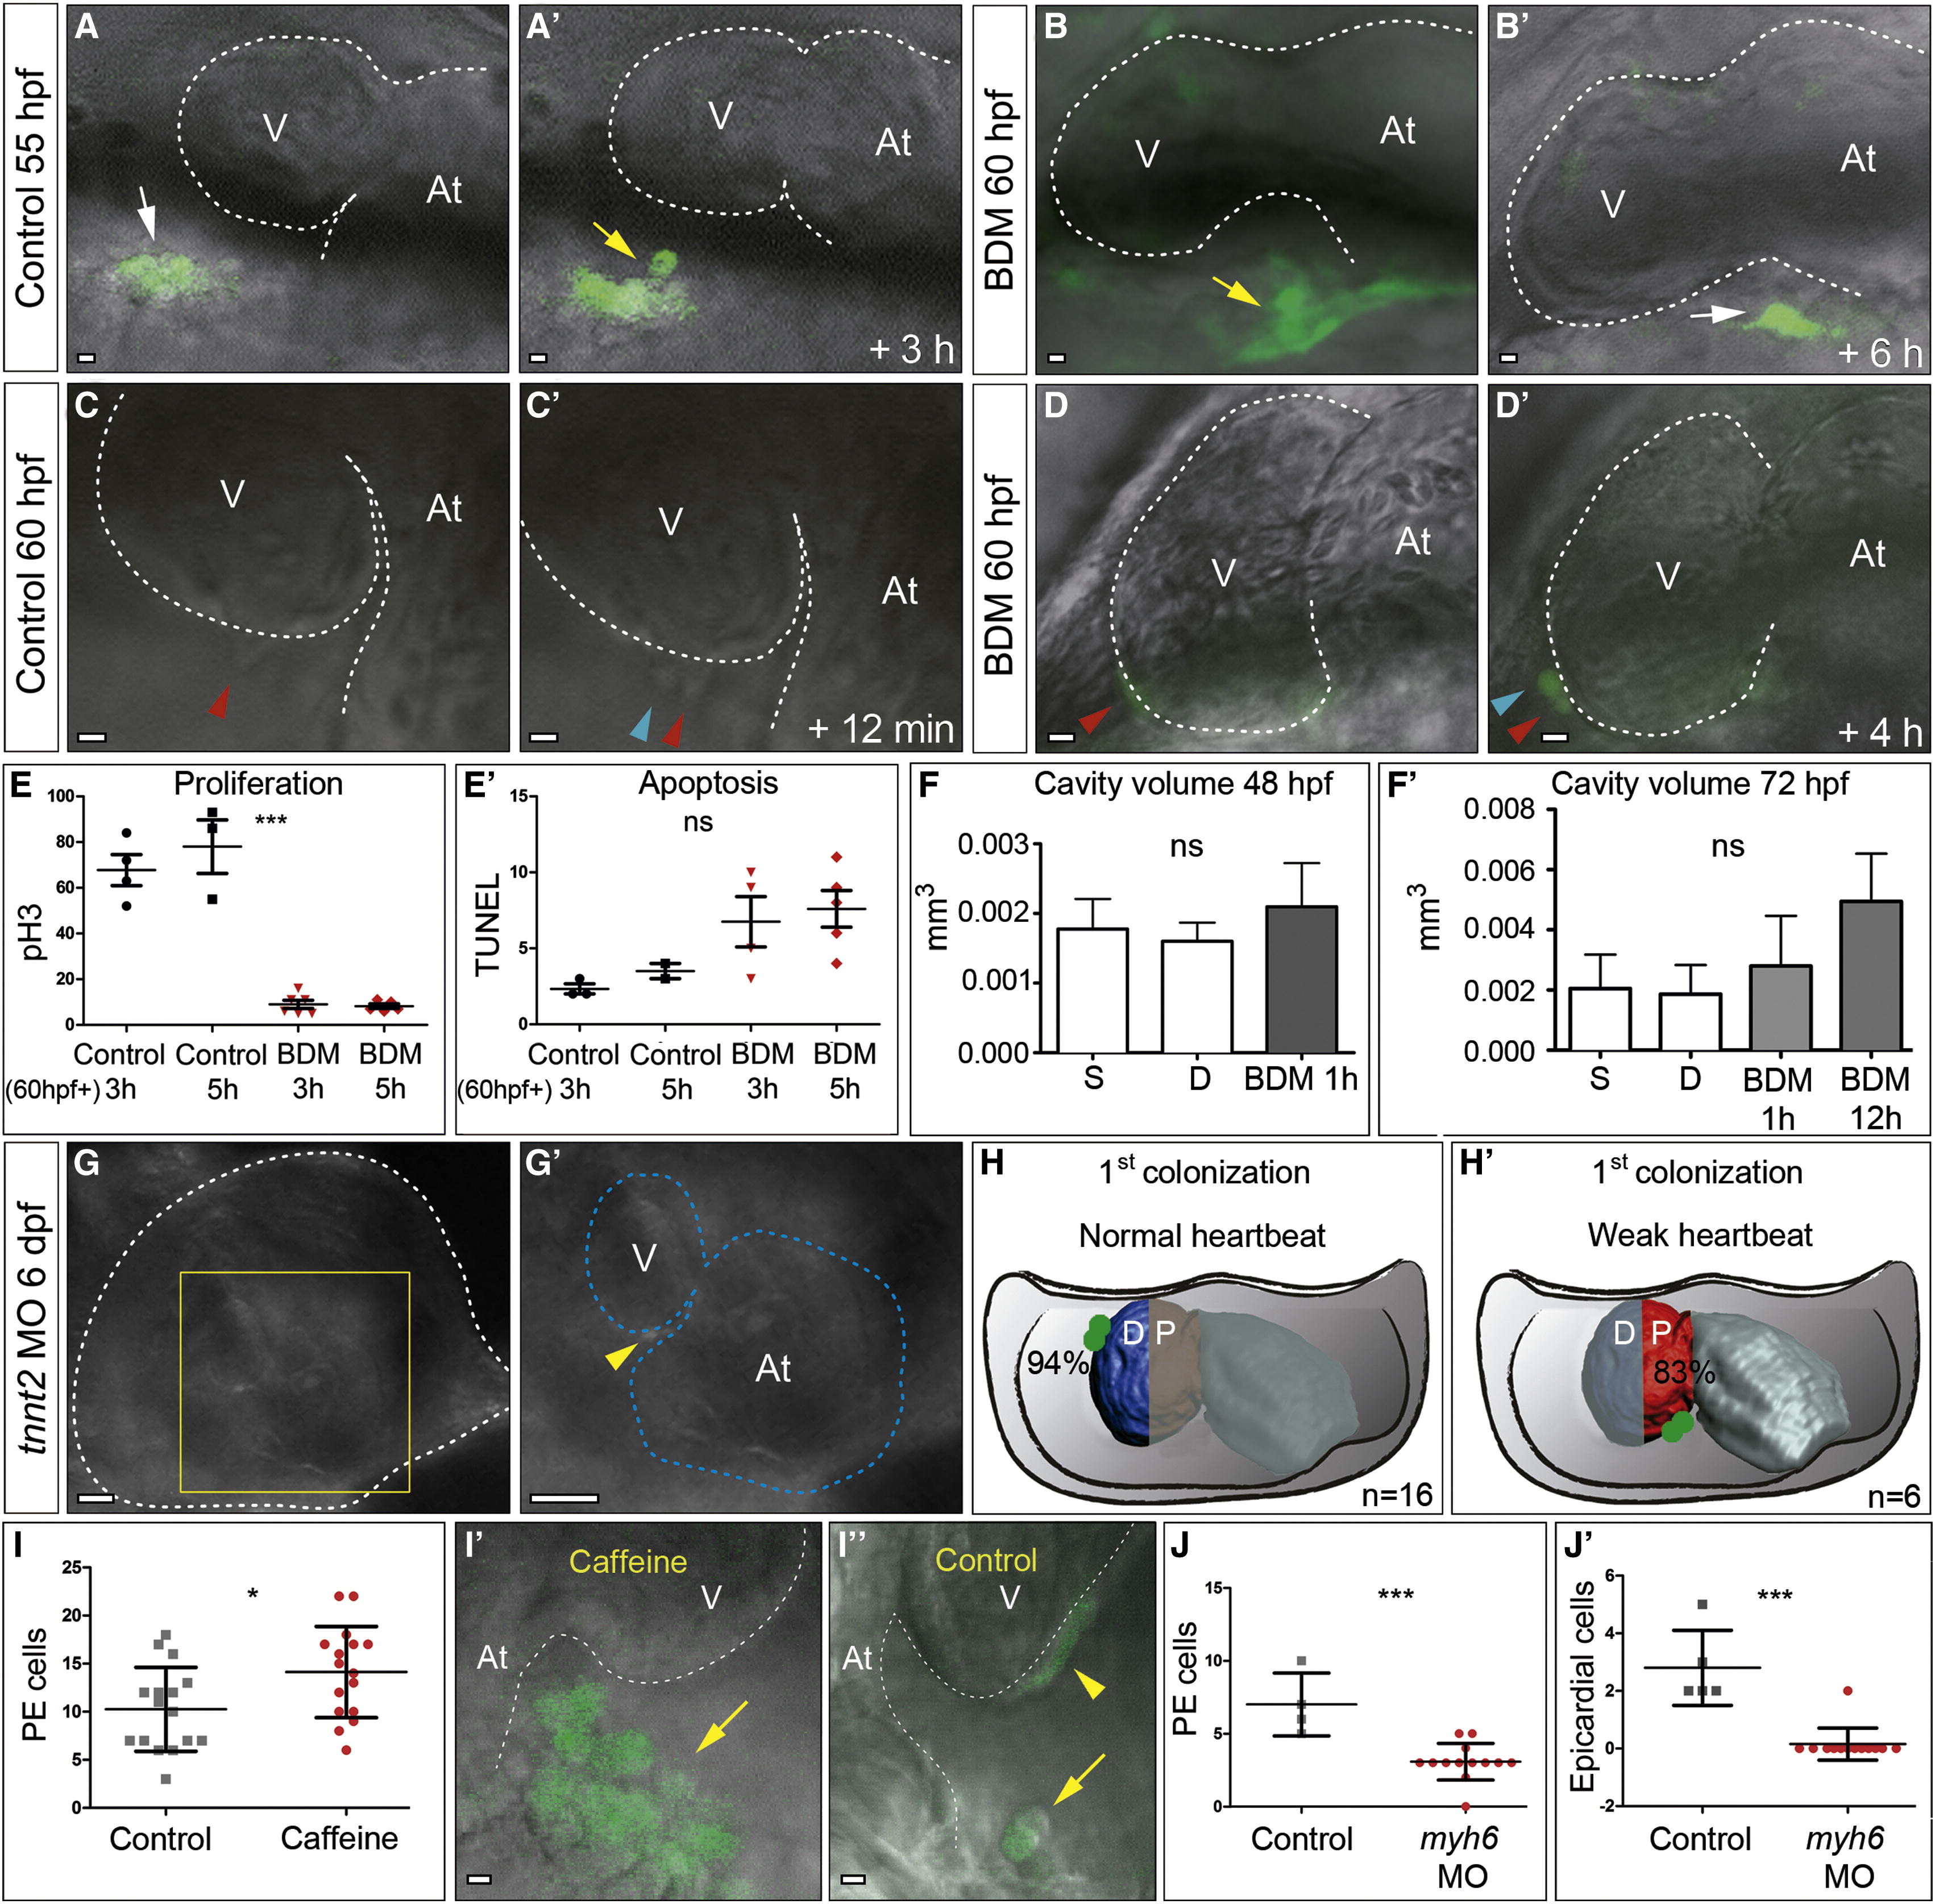
Fig. 2 The Heartbeat Is Necessary for PE Cluster Formation and Correct Transfer to the Myocardium
Panels show experiments performed with Epi:GFP larvae.
(A–D′) Confocal imaging of hearts at different stages. Dorsal is on the top.
(A and A′) In wild-type larvae at 55 hpf (control), mesothelial cells of the pericardial wall (white arrows) form a PE cluster (yellow arrow) (Movie S2).
(B and B′) BDM treatment inhibits PE formation and PE cells flatten (white arrow) instead of rounding up.
(C–D′) Epicardial cells proliferate normally in the absence of a heartbeat. Red arrowheads mark cells about to proliferate; blue arrowheads mark newly formed cells.
(E and E′) Quantification of proliferation (pH3 staining) and apoptosis (TUNEL staining) of pericardial mesothelial cells in the presence or absence of a heartbeat; 3 and 5 hr BDM treatments from 60 hpf onward were compared with controls fixed at the same stage. The y axis shows number of pericardial cells. p < 0.001.
(F and F′) Pericardial cavity volume at 48 and 72 hpf in systole (S) and diastole (D) in untreated larvae (n = 2 and 3) and after BDM treatment initiated 1 or 12 hr before, as indicated (n = 4 and 6).
(G–H′) Larvae with an altered heartbeat show a different pattern of myocardial ventricle colonization.
(G and G′) A few epicardial cells (yellow arrowhead) are observed in tnnt2 morphants with <100% penetrance, which have a weak heartbeat and strong edema. The white and blue dotted lines outline the pericardial cavity and myocardium, respectively.
(H and H′) Order of myocardial colonization by PE cells. In control larvae, epicardial cells first colonize the distal ventricle surface (D), while in weak-heartbeat tnnt2 morphants epicardial cells mostly colonized the proximal ventricle (P). Numbers indicate the percentages of animals with the reported colonization pattern and the total numbers of animals analyzed.
(I–I′′) Enlarged PE cluster in caffeine-treated animals.
(I) PE cell quantification of caffeine-treated (n = 16) versus untreated larvae (n = 16) revealed significant differences (p = 0.023; two-tailed Student’s t test).
(I′ and I′′) Merged bright-field and fluorescent images of PE clusters (yellow arrows) from a control and a caffeine-treated larva. The arrowhead indicates epicardial cells.
(J and J′) Impaired PE and epicardium formation in myh6 morphants revealed by cell quantification at 70 hpf (n = 21 control and 45 myh6 morphants; p < 0.0001, two-tailed Student’s t test).
In all graphs, bars indicate means and standard deviations. D, distal; myh6MO, myosin heavy polypeptide 6 morpholino; ns, not significant; P, proximal; pH3, phospho-Histone 3. Scale bars represent 10 μm (A–D′, I, and I′) and 20 μm (G and G′). See also Movie S2.