
|
Fig. 3
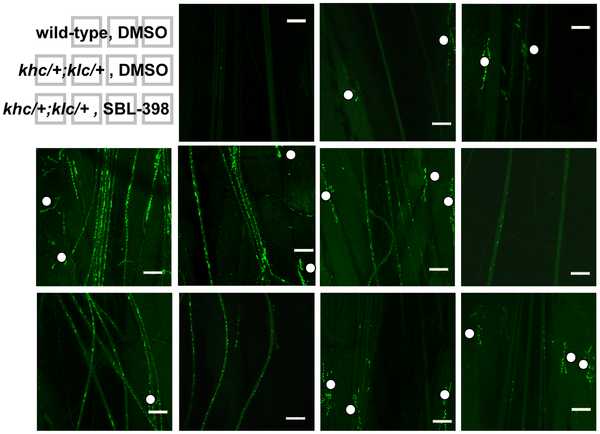
Figure 3. Reduction of neuronal aggregates by SBL-398; representative results.
Eleven images, each representing a different larva, depict the range of phenotypes observed for: wild-type larvae treated with DMSO (top row); khc/+; klc/+ larvae treated with DMSO (middle row); and khc/+; klc/+ larvae treated with 0.5 mM SBL-398 (bottom row). Central images on each row represent the most commonly observed phenotypes for each condition. Solid dots demarcate synaptic boutons, which are stained by anti-synaptogamin but should not be confused with intraneuronal aggregates. The genuine aggregates are distinguished by their distribution throughout the lengths of segmental nerves that have a generally longitudinal orientation. White bars represent 50 μm.