
|
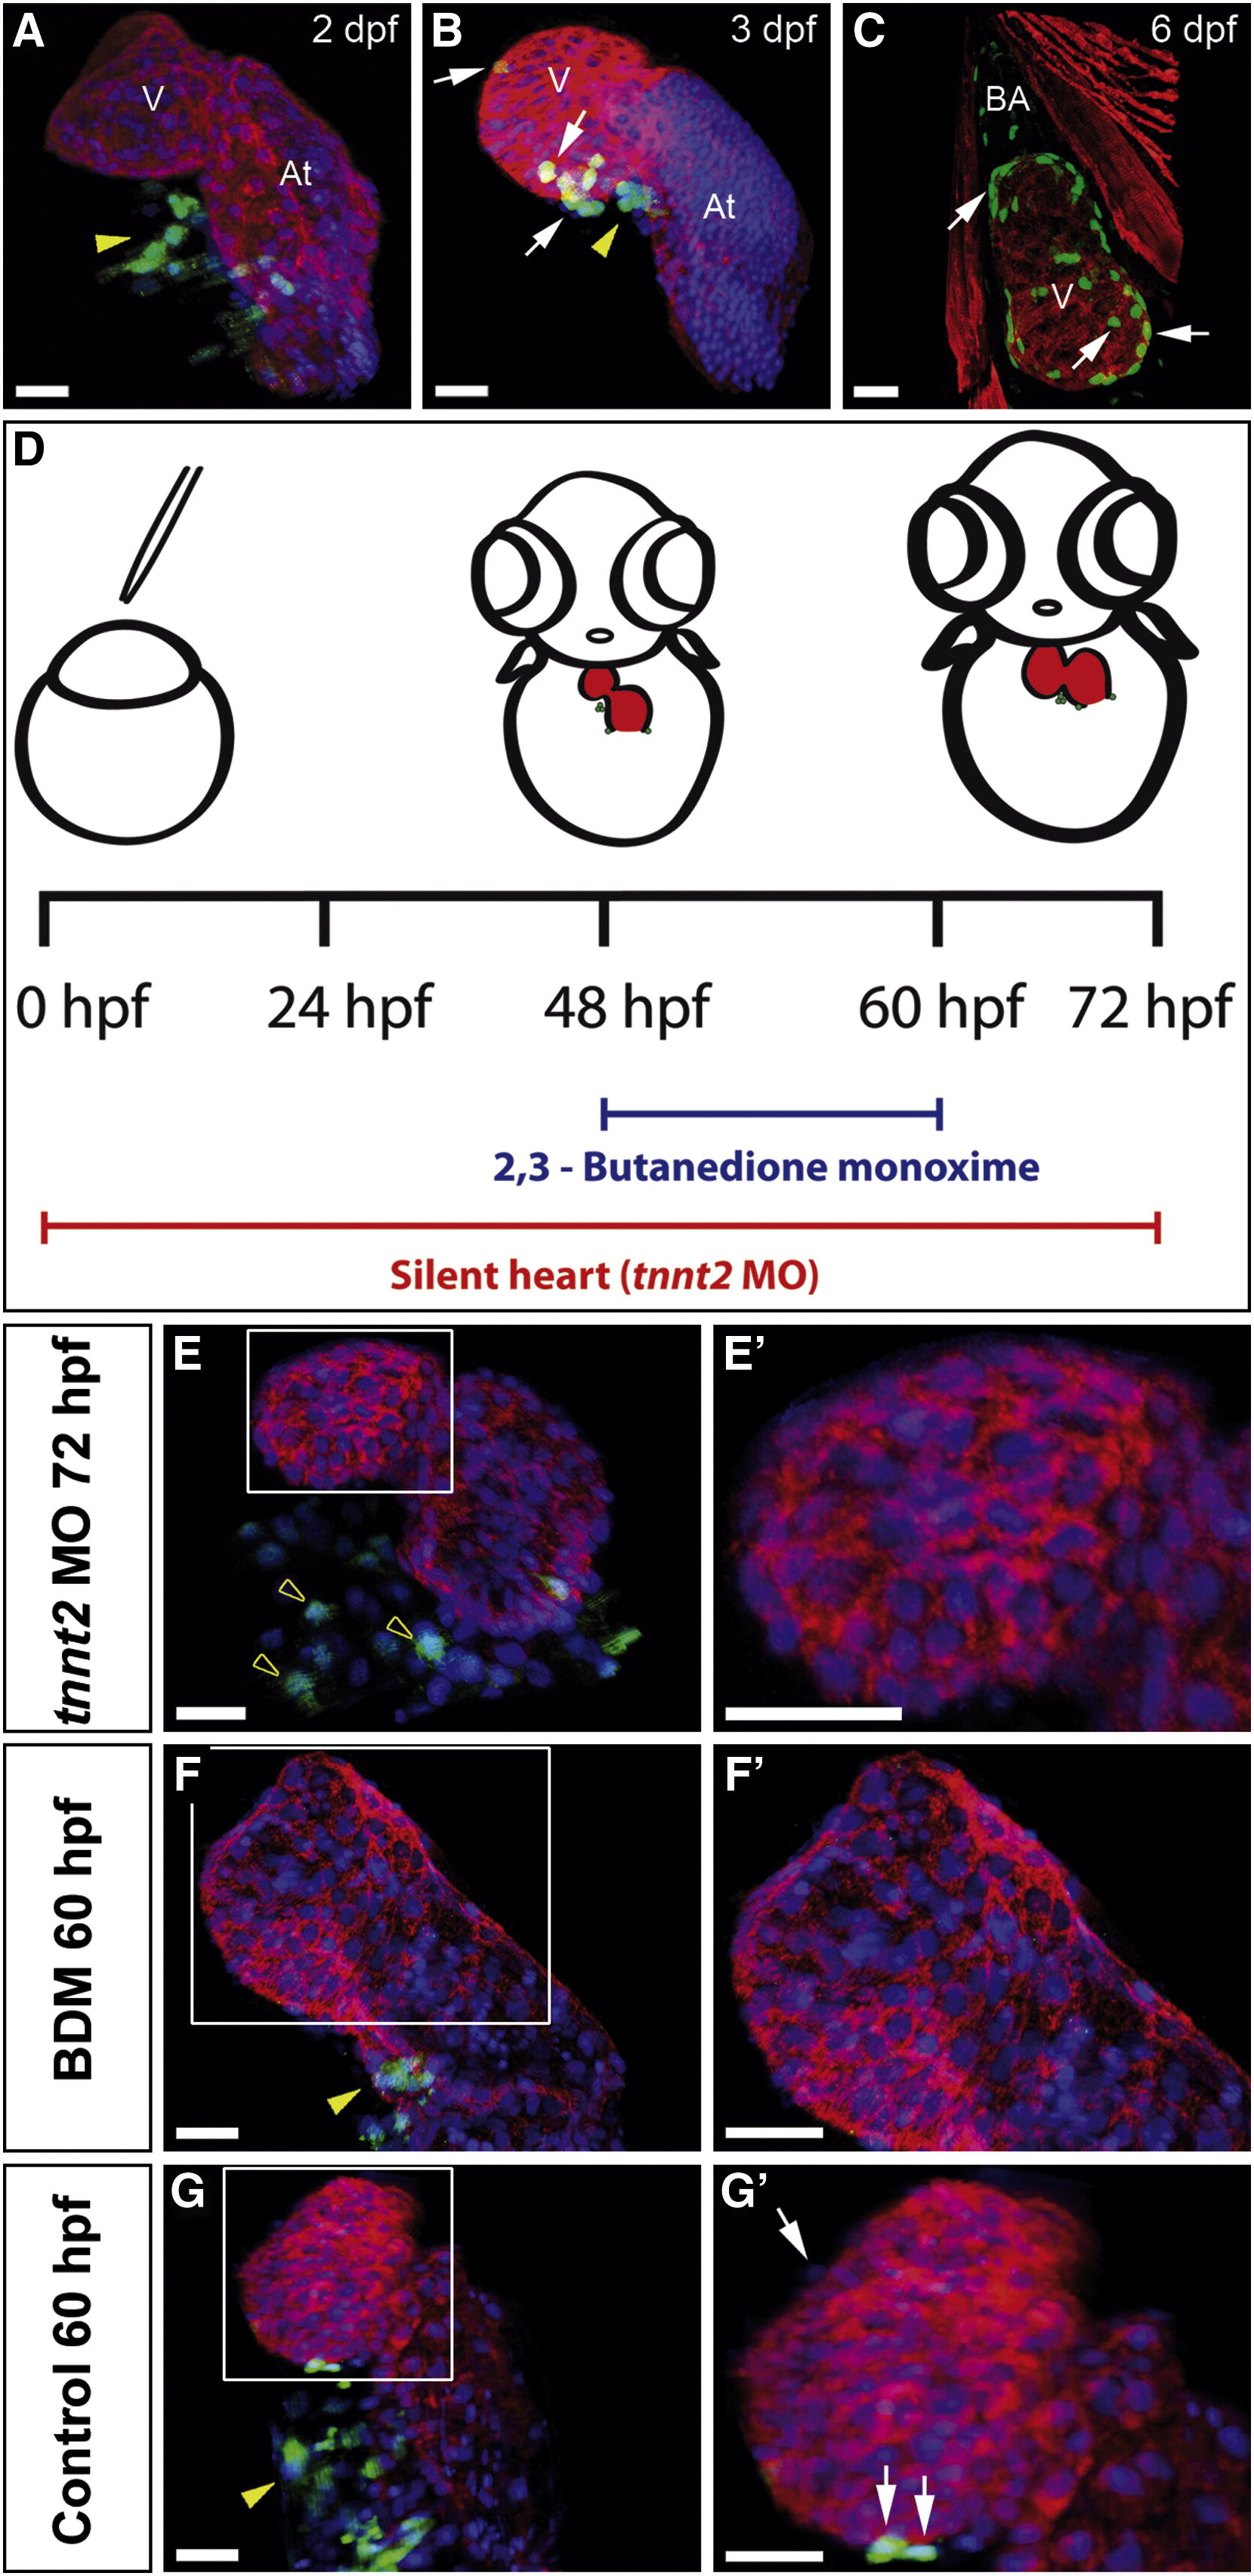
Fig. 1 Epicardium Formation Is Inhibited in the Absence of a Heartbeat
(A–C and E–G′) Immunohistochemical analysis of proepicardial (PE) and epicardial development. Panels show 3D projections of whole-mount hearts from Epi:GFP zebrafish larvae at different developmental stages stained with anti-myosin heavy chain (MHC) to detect myocardium (red) and DAPI to counterstain nuclei (blue). DAPI is not shown in (C) to improve visualization of the myocardium. GFP expression is shown in green. Yellow arrowheads mark PE cell clusters; white arrows mark epicardial cells. (E′)–(G′) are zoomed views of boxed areas in (E)–(G).(D) Scheme of experiments for inhibiting heart function by tnnt2MO-injection into single-cell stage embryos or BDM treatment between 48 and 60 hpf. Myocardium is shown in red, and GFP-positive cells are shown in green.
(E) Heart of a tnnt2 morphant at 72 hpf. Empty arrowheads mark scattered GFP-positive mesothelial cells at the venous pole, which do not form a PE cluster (Movie S1).
(F) Heart of a BDM-treated larvae.
(G) Control at 60 hpf.
At, atrium; BDM, 2,3-butanedione monoxime; dpf, days postfertilization; hpf, hours postfertilization; tnnt2 MO, troponin t2 morpholino; V, ventricle. Scale bars represent 30 μ m. See also Figure S1 and Movie S1.