
|
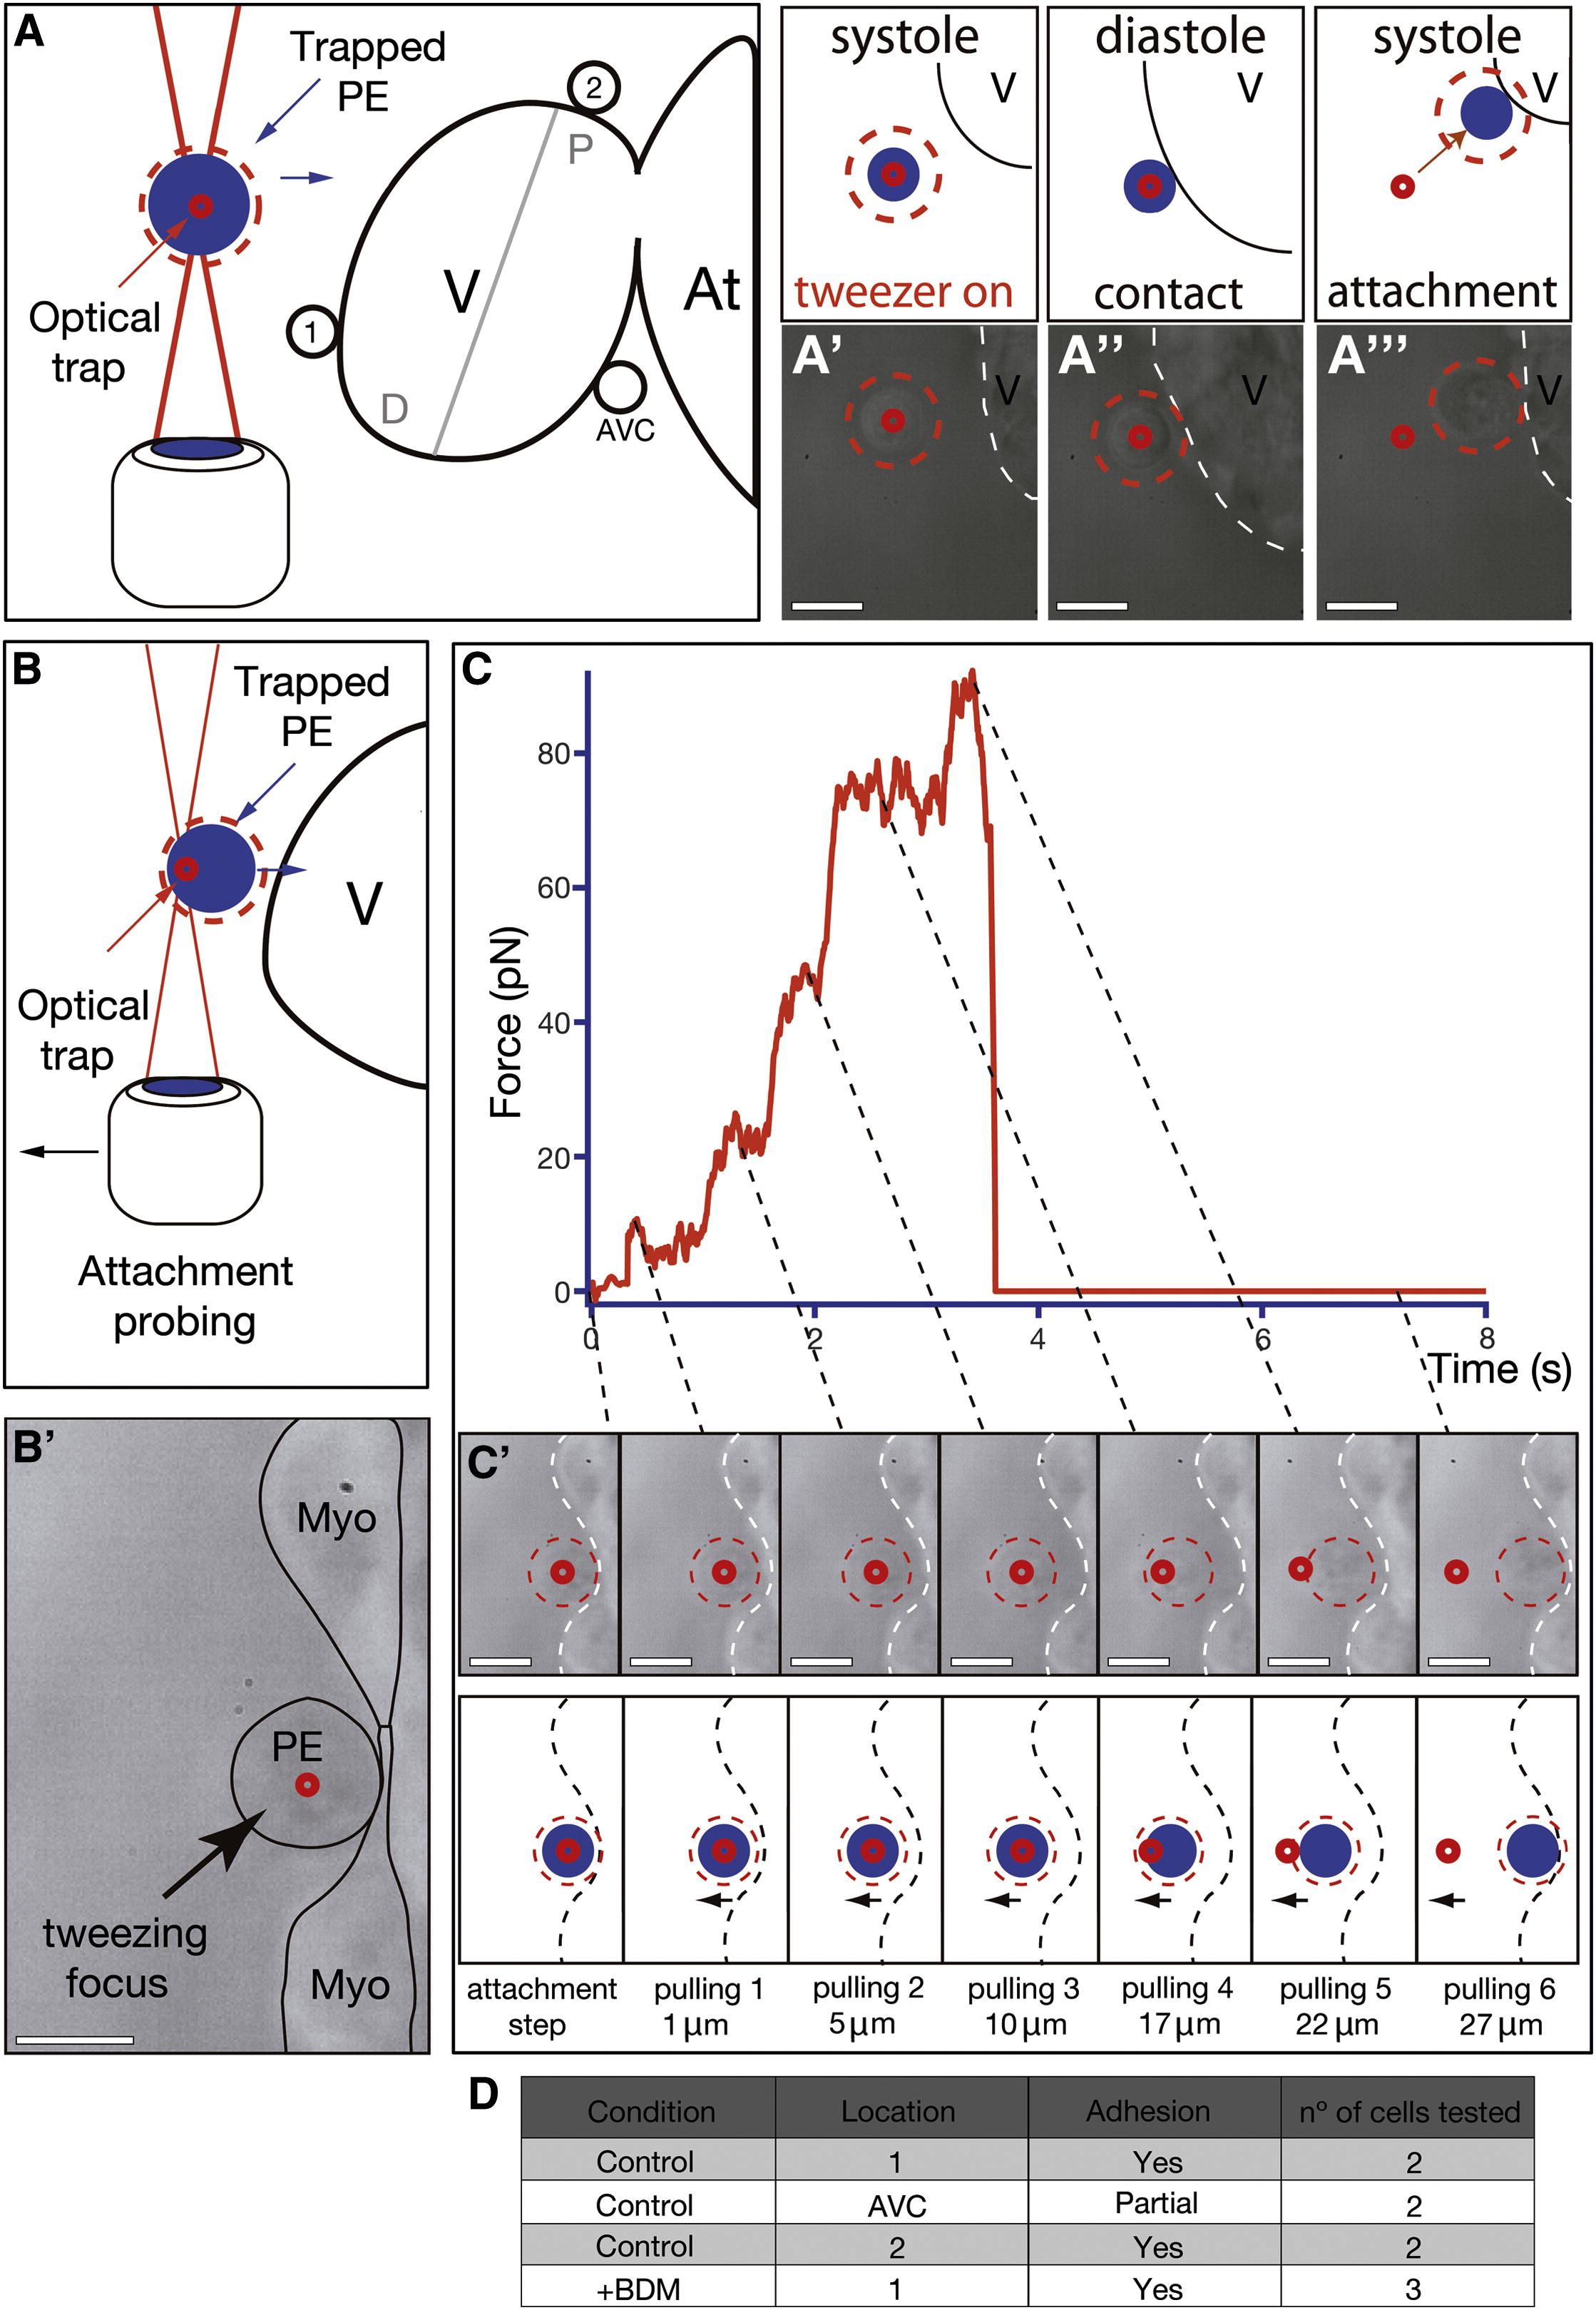
Fig. 6 Characterization of PE Cell Adhesion to the Myocardium
(A) Optical-tweezers setup used to study the propensity of PE cells to adhere to different myocardial regions including it, a region distal to it (region 1), and a region proximal to the AVC (region 2). The blue circle illustrates the trapped cell and the small red circle the approximate location of the optical trap. The red dotted circle around the cell facilitates its visualization during the experiment.
(A′–A′′′) Trapped PE cells adhere firmly to the ventricle if placed close to it (Movie S10).
(B–C′) Optical-tweezers pulling test to determine the role of heartbeat during PE cell attachment to the myocardium. After BDM treatment, a PE cell was trapped and forced to attach to the myocardium (time 0 s, B2 and C). After 30 s, the trapped cell was progressively pulled away from the myocardium.
(C and C′) Optical-tweezers forces applied to a cell over time during the pulling test. With increased distance, the magnitude of the force within the tweezers increases (10 pN, 20 pN, 40 pN, 70 pN, 90 pN), eventually resulting in the cell moving out of the tweezers because of its attachment to the myocardium (pulling 5). Further pulling resulted in the cell springing back to its original position on the surface of the heart (pulling 6) (Movie S11). The dotted lines link the force changes observed in the trap (C) with the images of the trapped cell at the same time (C′).
(D) Table summarizing the number, location, and types of adhesion events tested with the optical tweezers.
Scale bars represent 10 μm. See also Movies S10 and S11.