
|
Fig. 3
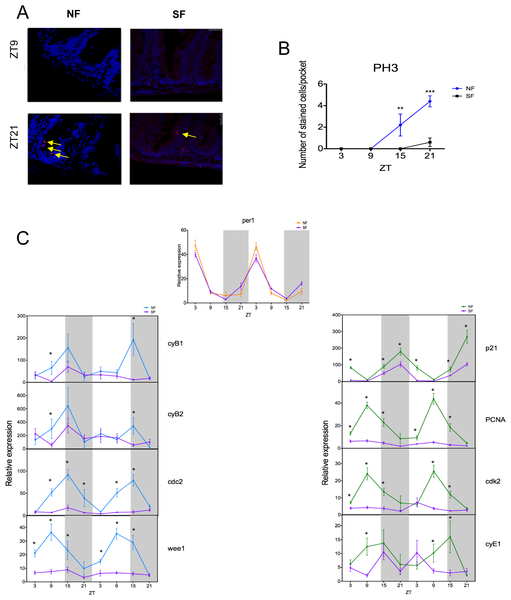
Figure 3. M phase is affected by starvation.
(A) Cell division is rhythmic under a normal feeding schedule (NF) (peak and trough shown), but this rhythm is lost when fish are starved (SF). DAPI is used here as a nuclear counterstain. (B) Cell division is largely abolished when no food is given. (C) The per1 rhythm is unaltered in NF and SF fish. However, all the M-phase genes studied (cyB1, cyB2, cdc2 and wee1) and most G1/S-phase genes (PCNA, cdk2 and cyE1) show reduced levels of expression, and a general loss of rhythmicity during starvation. p21 expression is the one exception, showing a relatively small response to starvation. White and grey backgrounds represent light and dark phases, respectively. Cell cycle gene data represents the mean ± SEM from 8 to 12 fish per time point. For panels B and C, NF data are compared to SF using a Student’s t-test (* p<0.05, ** p<0.01 and *** p<0.001).