
|
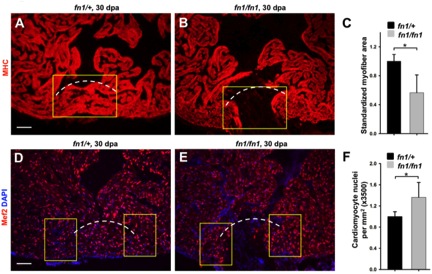
Fig. S2 Analysis of heart regeneration in fn1 mutants. (A, B) Myosin heavy chain (MHC; Red) staining of heterozygous (A) and homozygous fn1 mutant (B) ventricles at 30 dpa. (C) Quantification of MHC+ myofiber area from experiments in A and B. Myofiber area was measured by imaging the F59-stained ventricular section containing the largest apparent injury for each animal, quantifying the fluorescence using Openlab and ImageJ software, and calculating the fluorescent pixels within a yellow rectangle (150 μm x 210 μm) used to approximate the regenerated area. Dashed line indicates approximate resection plane. For each group, 5 zebrafish were assessed. Student’s t-test, *p < 0.05. Mean +/- s.e.m. Scale bars: 50 μm. (D, E) Mef2 (Red) staining of heterozygous (D) and homozygous fn1 mutant (E) ventricles at 30 dpa. (F) Quantification of Mef2+ cardiomyocyte nuclear density from experiments in D and E. To quantify Mef2+ cardiomyocytes, we imaged the three ventricular sections with the largest apparent injury per animal, and quantified Mef2+ cells within the yellow rectangles (150 μm x 105 μm) flanking the approximate resection area. Dashed line indicates approximate resection plane. For each group, 5 zebrafish were assessed. Student’s t-test, *p < 0.05. Mean +/- s.e.m. Scale bars: 50 μm.
Reprinted from Developmental Biology, 382(2), Wang, J., Karra, R., Dickson, A.L., and Poss, K.D., Fibronectin is deposited by injury-activated epicardial cells and is necessary for zebrafish heart regeneration, 427-435, Copyright (2013) with permission from Elsevier. Full text @ Dev. Biol.