
|
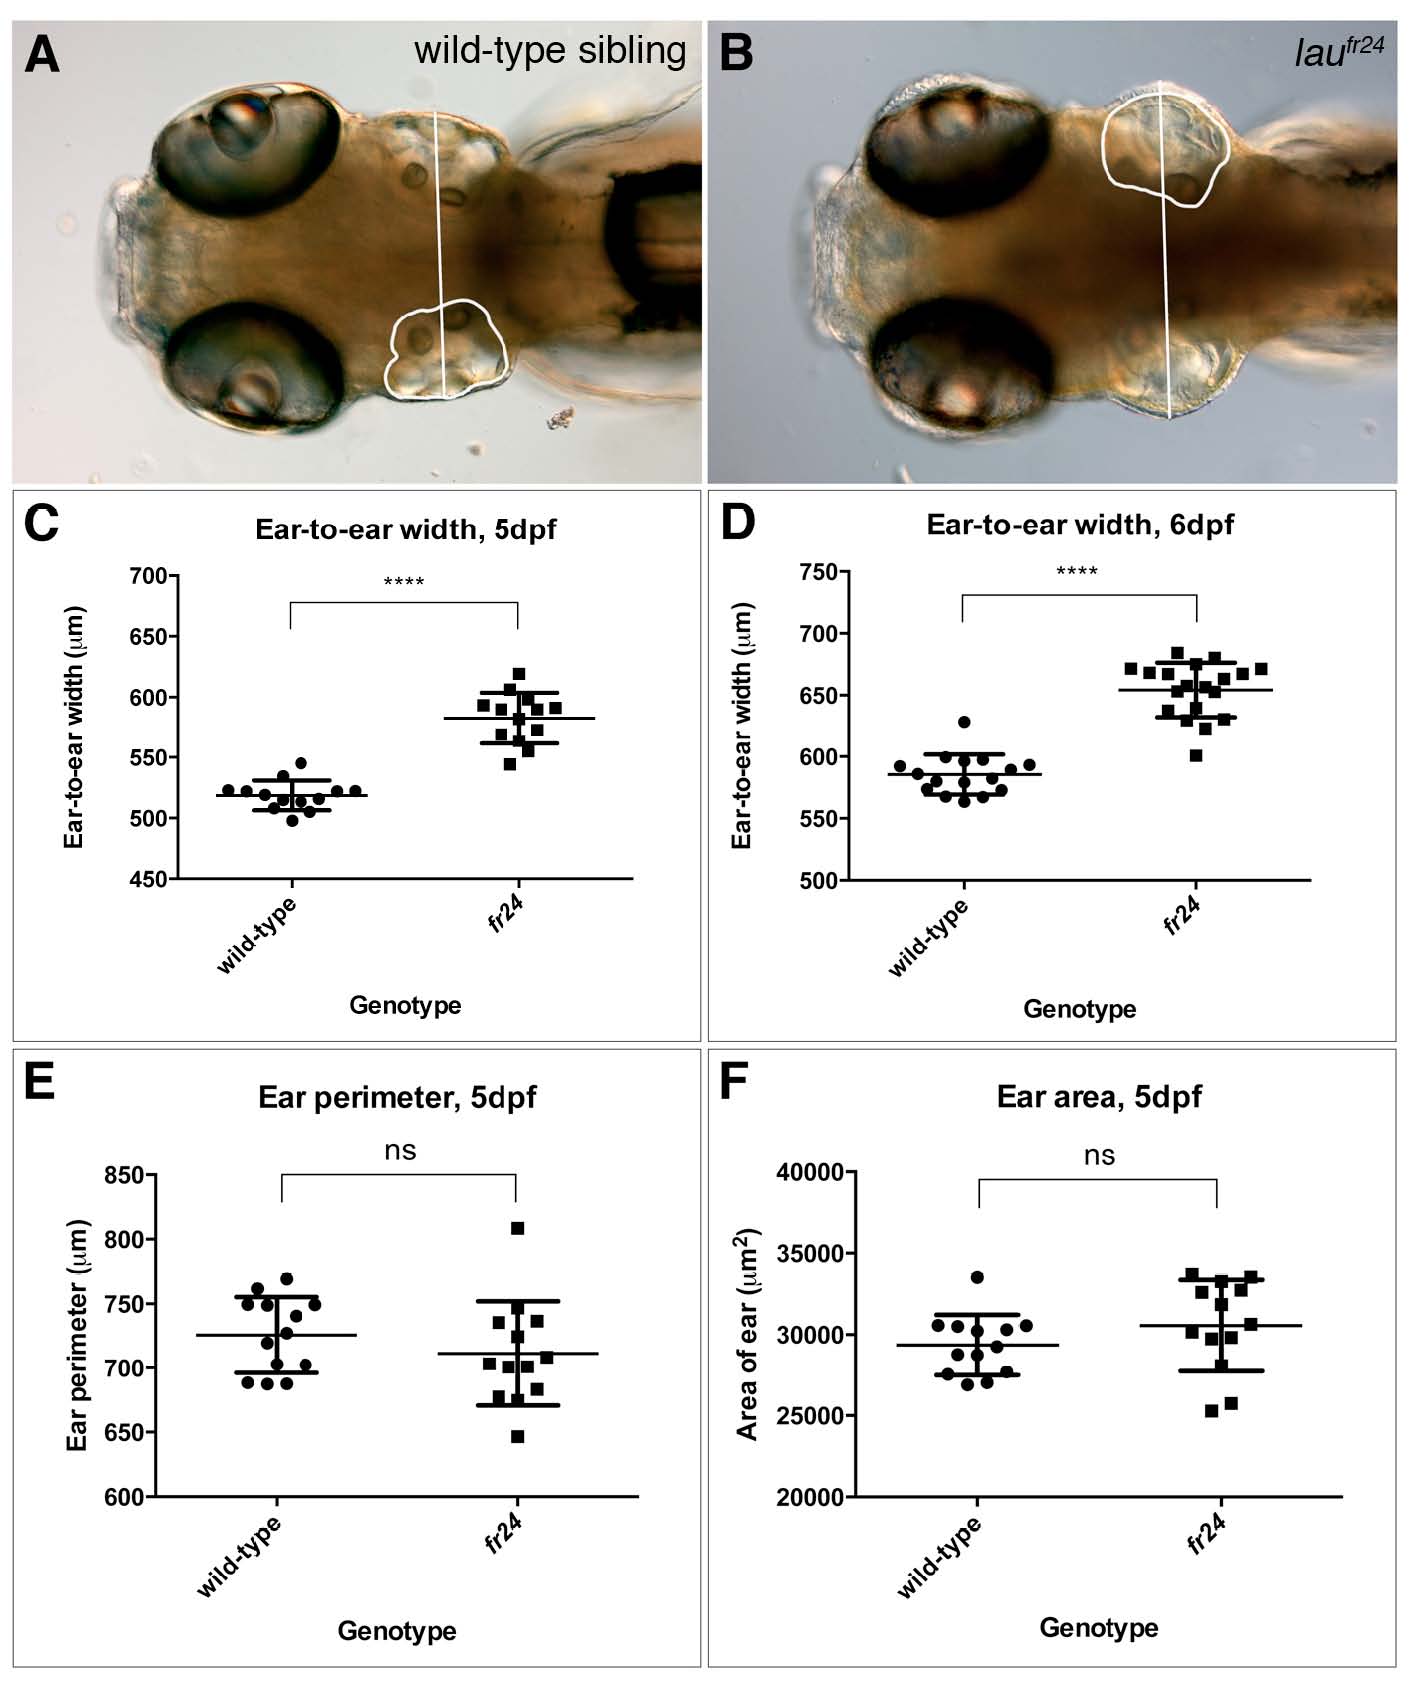
Fig. S2 Quantitation of the lauscher swollen ear phenotype. (A,B) Sample micrographs showing dorsal views of live wildtype sibling (A) and laufr24 mutant (B) embryos at 5 dpf. Measurements were taken of ear-to-ear width (straight white line) and ear perimeter (white line outlining ear) using CELLB software (Olympus). Embryos were treated with 1-phenyl 2-thiourea (PTU) to suppress development of pigmentation. Embryos were photographed at a focal plane that highlighted the largest visible dimensions for the parameters shown, and the ear chosen for measurement in each micrograph was the one with the most clearly visible outline. Ear cross-sectional area was calculated from the perimeter drawn, using CELLB software (Olympus). (C-F) Quantitation of ear-to-ear width (C,D), ear perimeter (E) and ear area (F); data were plotted using Prism 6 (GraphPad software). Ne13 for each data set. Error bars indicate standard deviation; ****P<0.0001 (unpaired, two-tailed t-test); ns, not significant.