
|
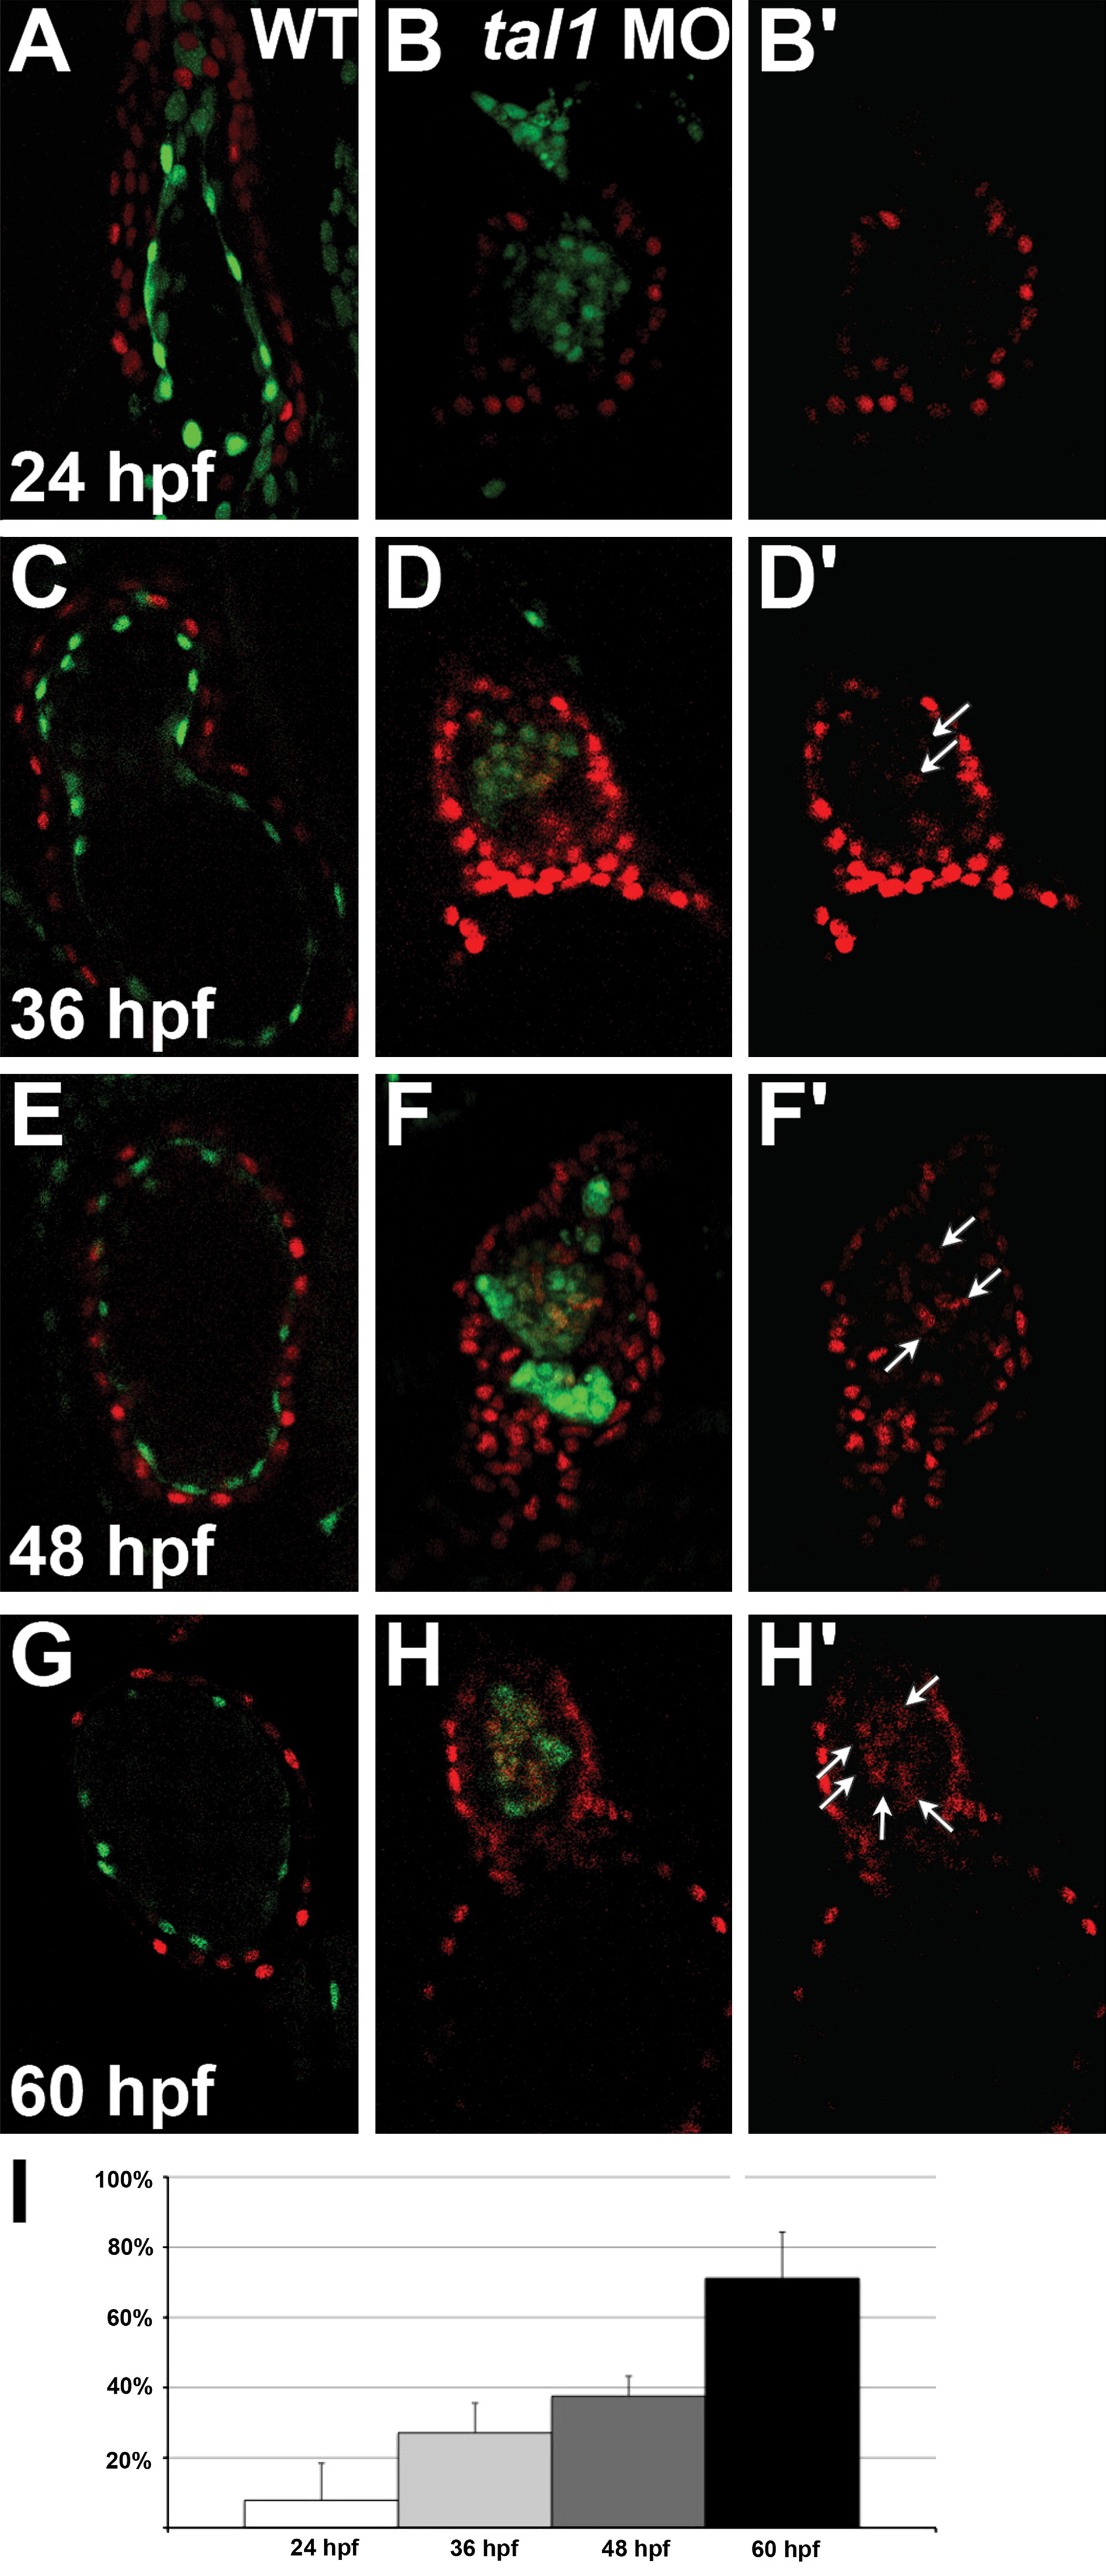
Fig. 8 Ectopic myocardial gene expression progressively increases within the tal1-deficient endocardium. (A–H) Optical sections from confocal stacks of wild-type (A, C, E, and G) and tal1-deficient (B, D, F, and H) hearts expressing Tg(myl7:H2A-mCherry) (red) and Tg(fli1a:negfp) (green) at 24 hpf (A and B), 36 hpf (C and D), 48 hpf (E and F) and 60 hpf (G and H), arterial pole at the top. These representative hearts demonstrate the progressive increase in the percentage of endocardial cells expressing Tg(myl7:H2A-mCherry) that occurs between 24 and 60 hpf in tal1-deficient embryos (B, D, F, and H). In contrast, the wild-type endocardium never expresses Tg(myl7:H2A-mCherry) (A, C, E, and G). (B′, D′, F′, and H′) Images display only the myocardial marker from the sections shown in (B, D, F, and H). Arrows indicate examples of endocardial cells ectopically expressing Tg(myl7:H2A-mCherry). (I) Bar graph depicts the average percentage of tal1-deficient endocardial cells expressing Tg(myl7:H2A-mCherry) at each stage examined. Error bars indicate standard deviation (n=4–8 embryos per stage).
Reprinted from Developmental Biology, 383(2), Schumacher, J.A., Bloomekatz, J., Garavito-Aguilar, Z.V., and Yelon, D., tal1 regulates the formation of intercellular junctions and the maintenance of identity in the endocardium, 214-226, Copyright (2013) with permission from Elsevier. Full text @ Dev. Biol.