
|
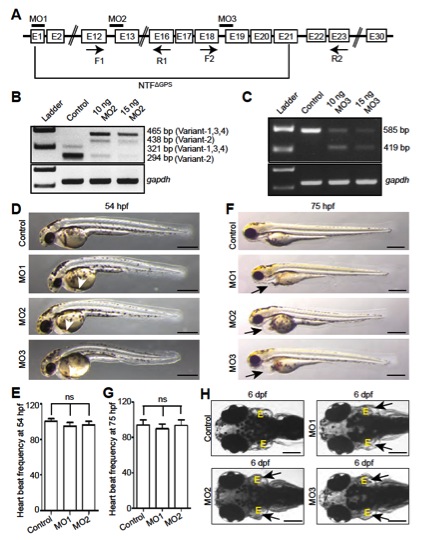
Fig. S5 Full-length gpr126 knockdown causes pericardial edema. (A) Schematic depiction of zebrafish prespliced gpr126 mRNA. Exons are represented by boxes, and introns are represented by lines. Bars represent the different morpholino binding sites. Arrows below the respective exons indicate primer binding sites; these are used to analyze the efficiency of gene knockdown by RT-PCR. (B and C) RT-PCR analysis of cDNA made from RNA isolated from 2-dpf control and MO2- or MO3-injected embryos using F1 and R1 primers for MO2 (B) and F2 and R2 primer for MO3 (C) as indicated in A. gapdh was used as loading control. MO2 binding resulted in 144-bp-long intron insertions (B). MO3 binding caused 166-bp-long exon deletions (C) causing a frame shift. (D and F) Brightfield images of control- or morpholino-injected embryos at 54 hpf (D) and 75 hpf (F). gpr126 knockdown resulted in mild accumulation of blood at the sinus venosus (arrowheads) at 54 hpf (D). Prominent pericardial edema (arrows) was observed at 75 hpf in Gpr126-depleted embryos (F). (Scale bar: 400 μm.) (E and G) Quantification of cardiac contraction frequency of phenol red (control)- or morpholino-injected embryos at 54 hpf (E) or 75 hpf (G). Cardiac contraction frequency of the phenol red-injected embryos was set to 100%. (H) Dorsal view of a phenol red-injected WT larva and MO1-, MO2-, or MO3-injected larva at 6 dpf. MO1, MO2, and MO3 injection all caused enlarged ears (arrows). (Scale bar: 200 μm.) ns, not significant; NTFΔGPS, N-terminal fragment up to the st49 mutation site.