
|
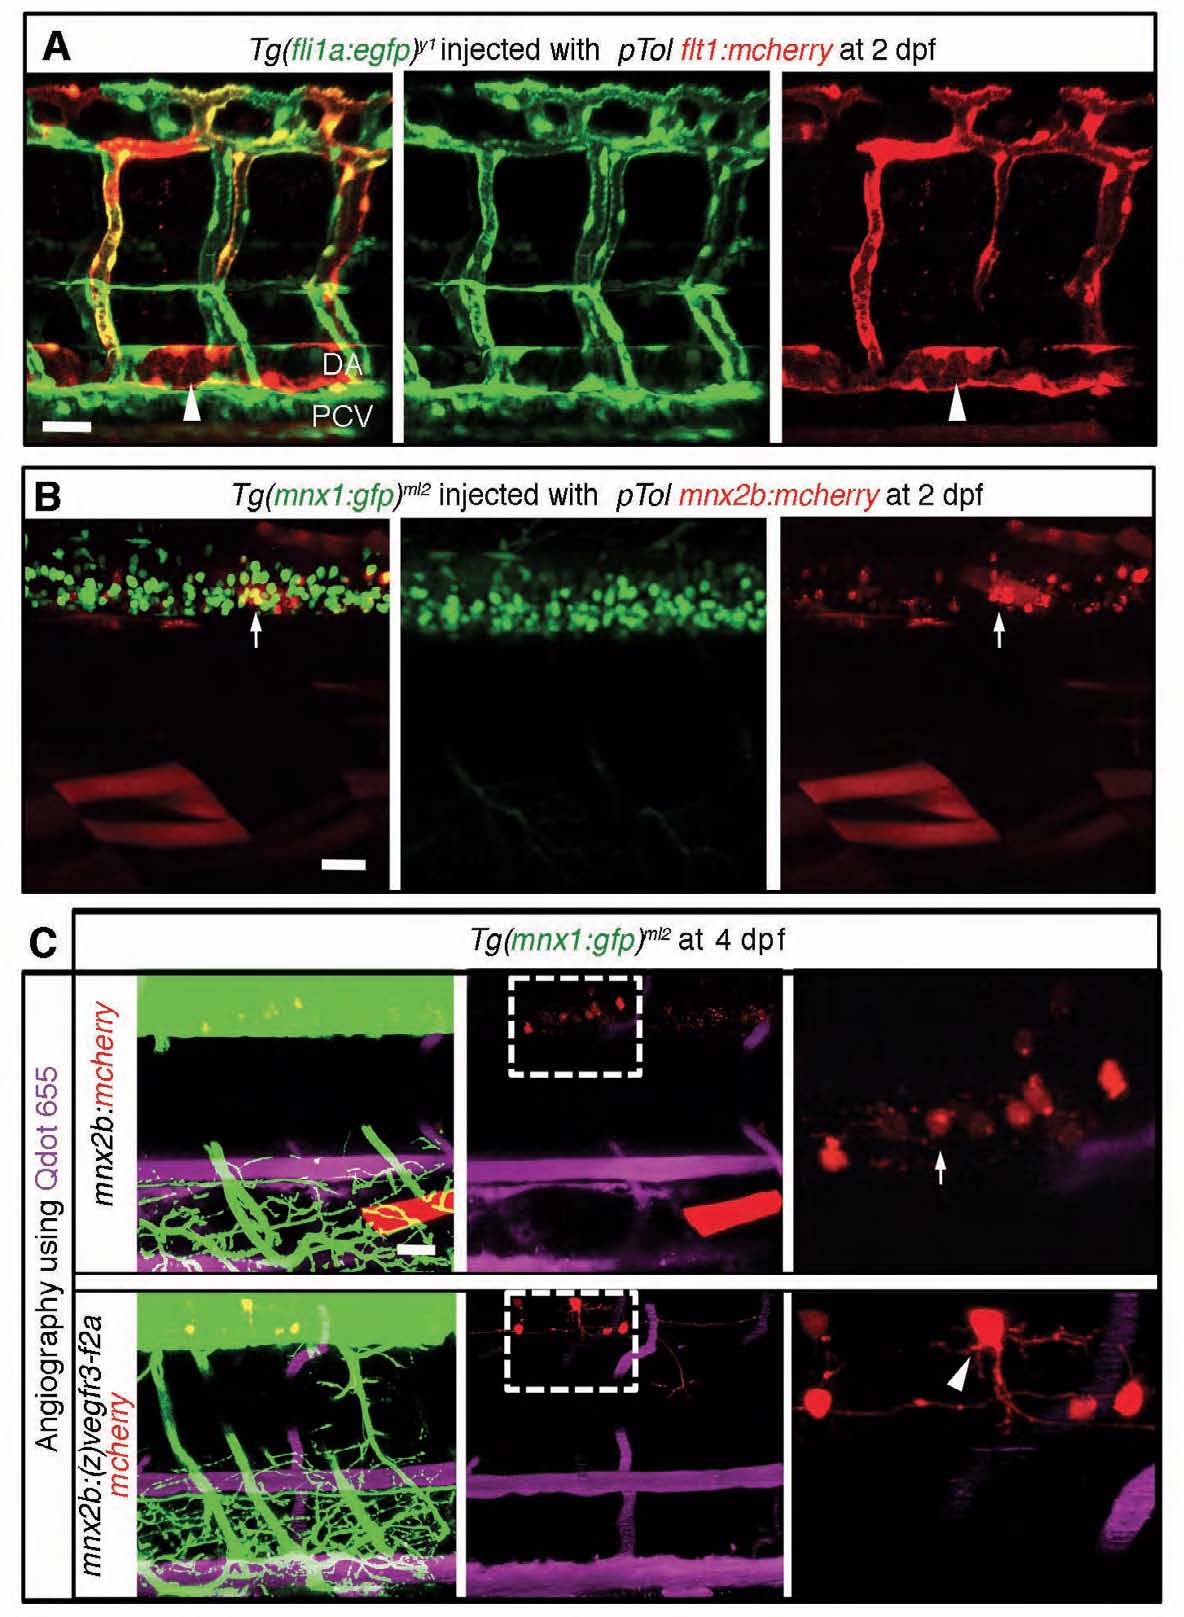
Fig. S4 Tissue-specific expression of genes driven by the flt1 and the mnx2b promoter used for Tol2-mediated gene transfer. (A,B) 3D-rendered confocal stack of fluorescence images (lateral view) of a Tg(fli1a:egfp)y1 embryo (2 dpf) injected with pTol flt1:mcherry plasmid (A) and of a Tg(mnx1:gfp)ml2 embryo (2 dpf) injected with pTol mnx2b:mcherry plasmid (B). Arrowheads indicate the expression of mCherry in the DA (A). Arrows indicate the expression of mCherry in motoneurons (B). DA, dorsal aorta; PCV, posterior cardinal vein. Note that mCherry is observed in the DA and arterial intersegmental vessels but not in the PCV in A. (C) 3D-rendered confocal stack images (lateral view) of Tg(mnx1:gfp)ml2 embryos transiently expressing the molecules indicated at the left. The embryos were injected with Quantum (Q) dot 655 into the blood vessels at 4 dpf. Left panels, merged images of GFP, mCherry and Qdot 655 images; center panels, merged images of mCherry and Qdot 655 images; right panels, enlarged image of boxed region of the center panels. Arrow and arrowhead indicate expression of mCherry in the motoneurons. Scale bars: 25 μm.