
|
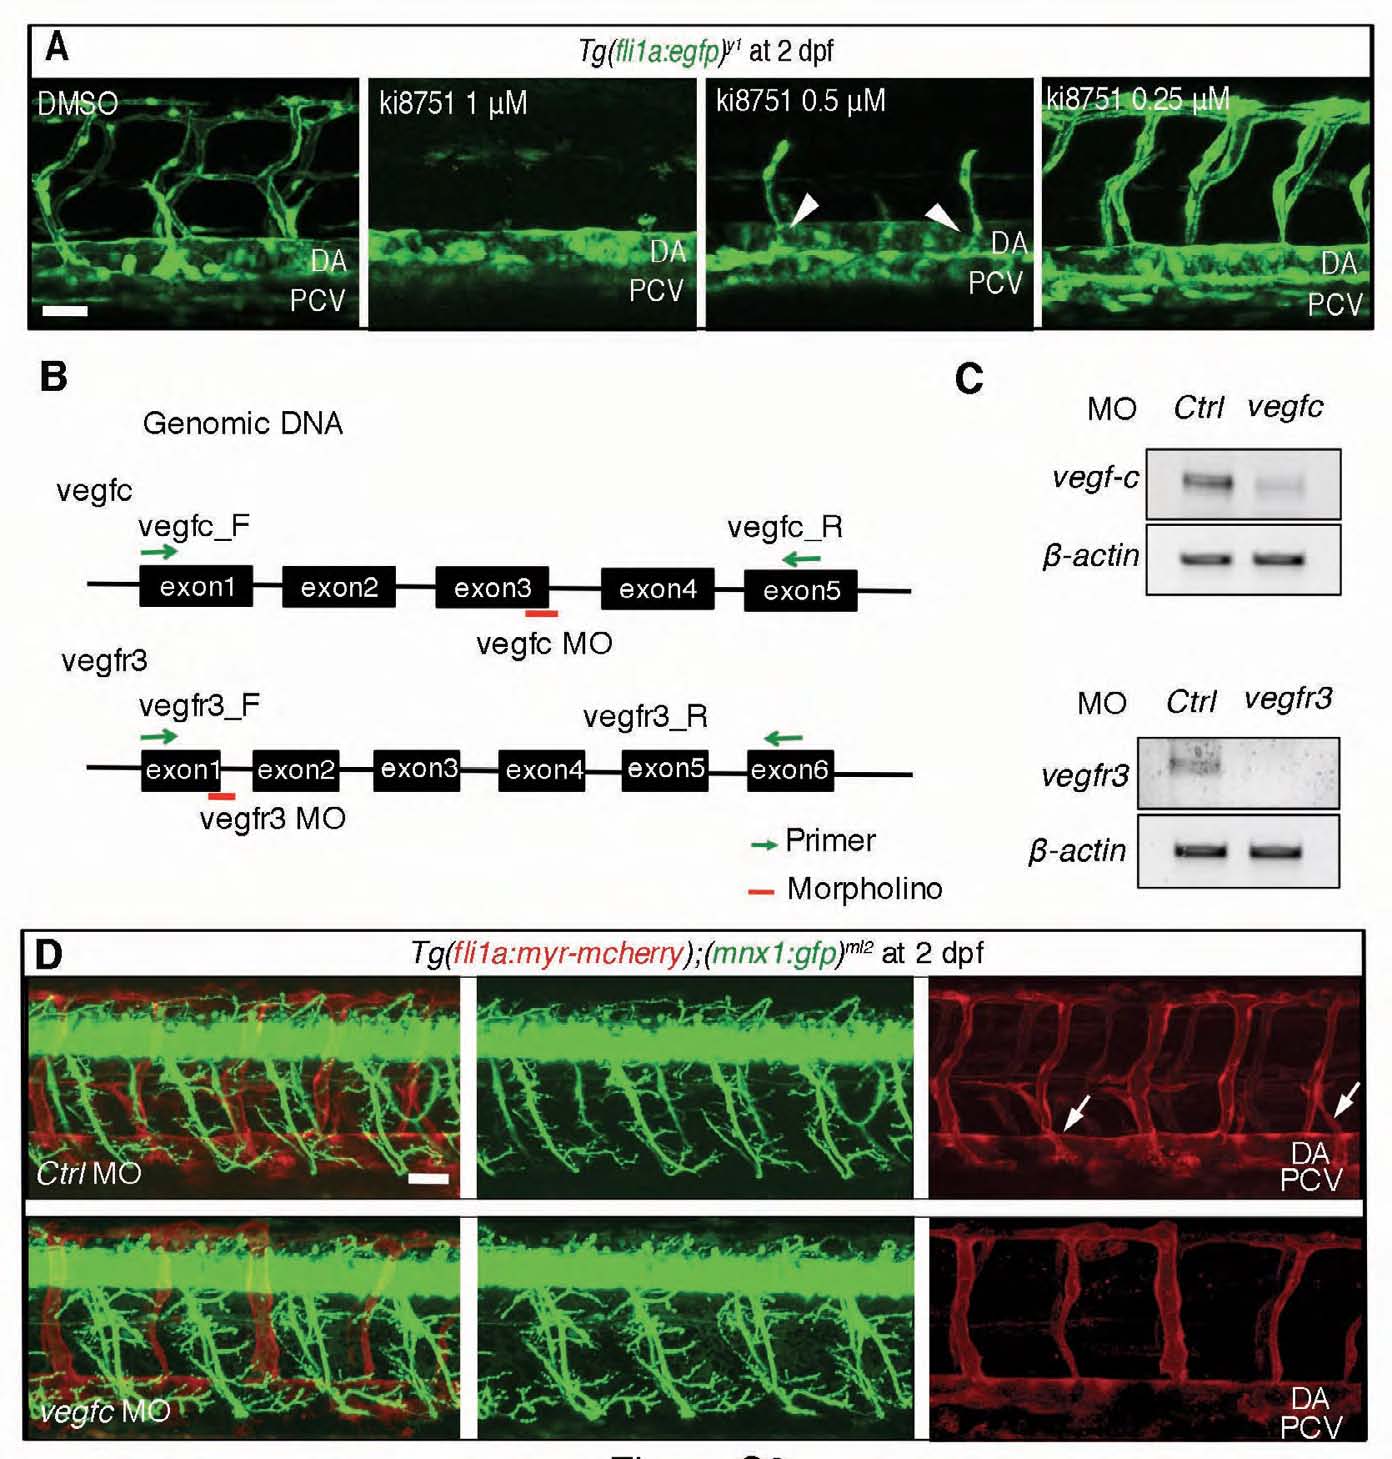
Fig. S3 Schematic illustration of the vegfc and vegfr3 genes and the primer sets for verifying the expression of vegfc and vegfr3 mRNAs. (A) 3D-rendered confocal stack images (lateral view) of a Tg (fli1a:egfp)y1 embryo treated with DMSO (control) and ki8751 (1 μM, 0.5 μM and 0.25 μM) at 2 dpf. Arrowheads indicate the secondary sprouting from the PCV. (B) vegfc and vegfr3 genes with the primers for examining the expression of vegfc and vegfr3 mRNAs and with the morpholinos (MOs) blocking splicing. (C) RT-PCR analyses using the primers indicated at the left and RNAs prepared from the embryos injected with control (Ctrl) MO or target MOs as indicated at the top. (D) 3D-rendered confocal stack of fluorescence images (lateral view) of Tg(fli1a:myr-mcherry);(mnx:gfp)ml2 embryos treated with either control MO (Ctrl, top panels) or vegfc MO (bottom panels) at 2 dpf. Left column, merged images; center column, GFP images; right column, mCherry images. Arrows indicate the secondary sprouts from the PCV. Anterior is to the left. DA, dorsal aorta; PCV, posterior cardinal vein. Scale bars: 25 μm.