
|
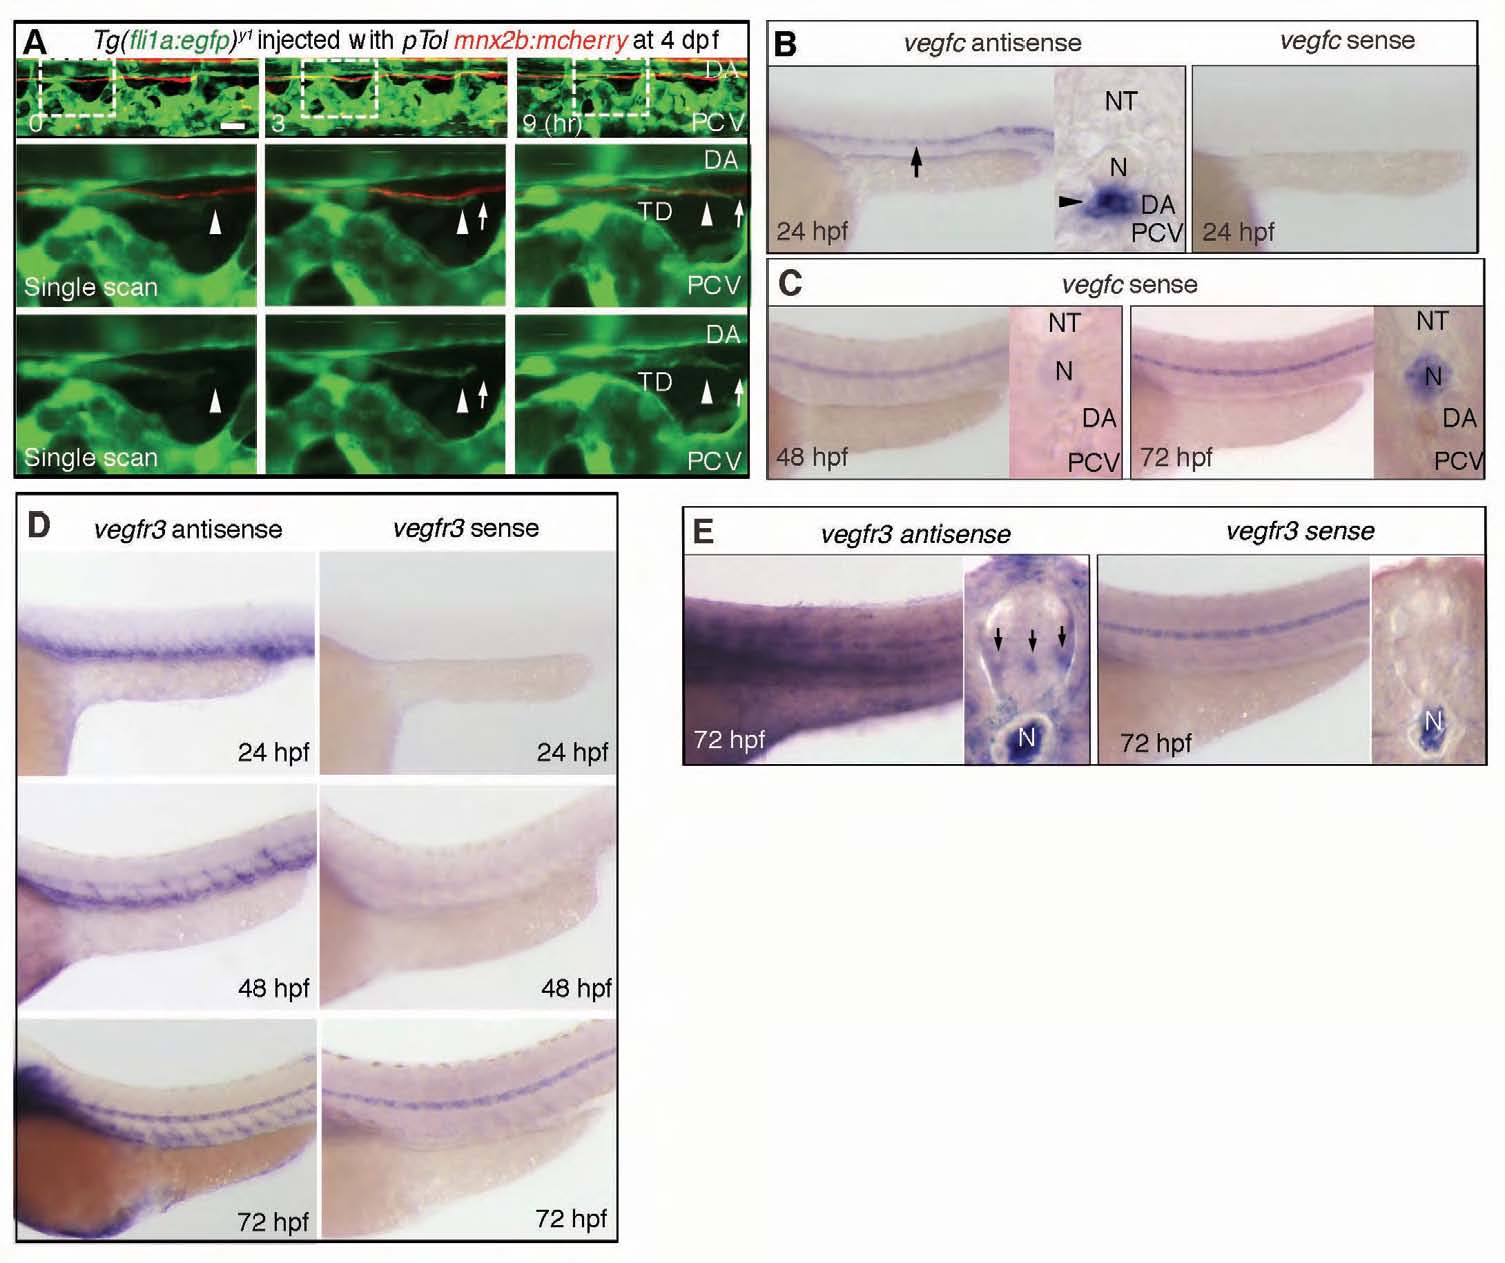
Fig. S2 Development of the thoracic duct along the axons of motoneurons. (A) Time-sequential confocal images (lateral view) of a Tg(fli1a:egfp)y1 embryo injected with pTol mnx2b:mcherry plasmid and transposase mRNA for Tol2 transposon-mediated gene transfer. Elapsed time (hours) from the start point (4 dpf) of time-lapse imaging is shown in the top panels. Top panels, merged images of GFP and mCherry; middle panels, enlarged single scan images of boxed regions in top panels; bottom panels, enlarged single scan images of GFP images of boxed regions in the same column. Arrows indicate the tip of developing thoracic duct. Arrowheads denote the location of the tip when starting time-lapse imaging. Scale bar: 25 mm. (B,C) Expression analyses of vegfc mRNA by in situ hybridization at 24 hpf (B) and negative control of those at 48 and 72 hpf (C). Cross-sectioned images are on the right side of each panel. Arrow and arrowhead indicate the expression of vegfc in the DA. (D) Expression analyses of vegfr3 mRNA by in situ hybridization at 24 hpf (top), 48 hpf (middle) and 72 hpf (bottom). (E) The result of longer reaction of detection of (D, bottom) with the transverse section images. Arrows denote the expression of vegfr3 in neural tube. DA, dorsal aorta; N, notochord; NT, neural tube; PCV, posterior cardinal vein.