
|
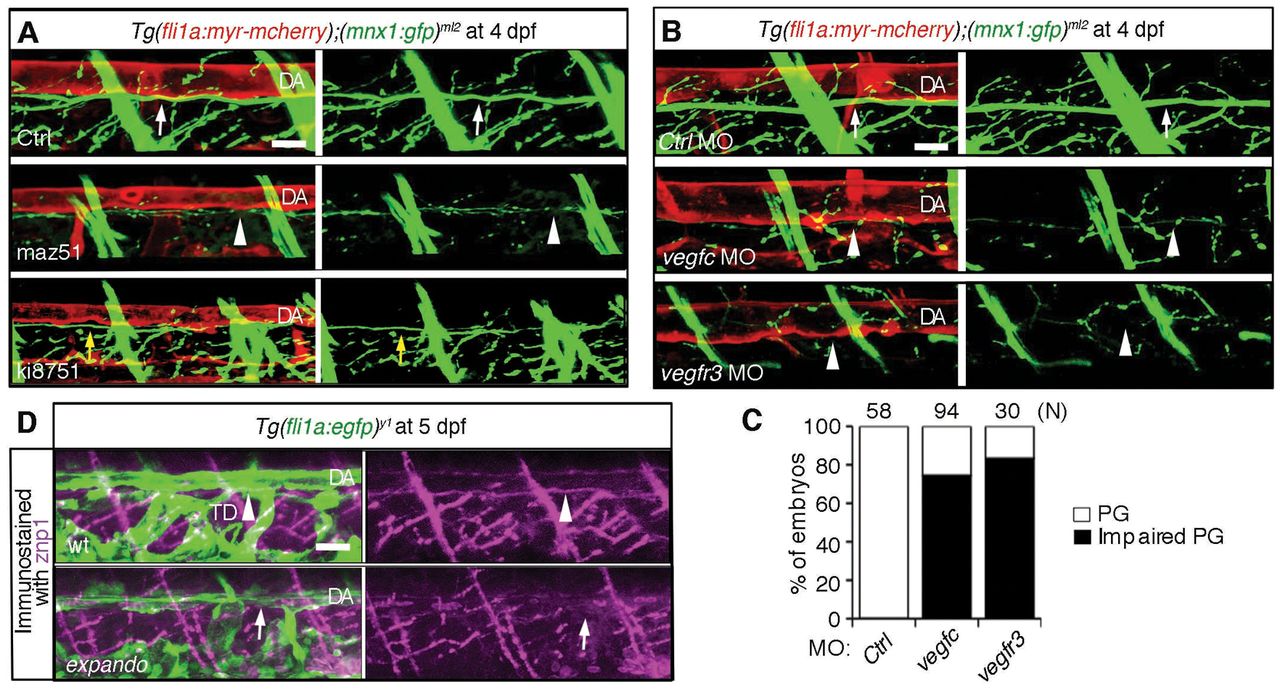
Fig. 6 Requirement of Vegfc and Vegfr3 for alignment of motoneuron axons and dorsal aorta. (A) 3D-rendered confocal stack images (lateral view) of Tg(fli1a:myr-mcherry);(mnx1:gfp)ml2 embryos treated with control DMSO (Ctrl, upper panels), with maz51 (middle panels) or with ki8751 (lower panels) at 4 dpf. Left panels, merged images of mCherry and GFP; right panels, GFP images. White arrows indicate the motoneurons beneath the DA. Arrowheads indicate the reduced growth of motoneuron axons beneath the DA. Yellow arrows indicate the slight reduction of growth of motoneuron axon beneath the DA. (B) 3D-rendered confocal stack images (lateral view) of Tg(fli1a:myr-mcherry);(mnx1:gfp)ml2 embryos treated with control MO (Ctrl, top panels), with vegfc MO (middle panels) or with vegfr3 MO (bottom panels). Left panels, merged images of mCherry and GFP; right panels, GFP images. Arrows indicate the motoneuron axons beneath the DA. Arrowheads indicate the reduced interaction of motoneurons and dorsal aorta. (C) Quantitative analyses of impairment of parallel growth (PG) of the embryos grouped as in B. The number (n) of the embryos examined for quantitative analyses is indicated at the top. (D) Immunohistochemical study of Tg(fli1a:egfp)y1 embryos (top) and vegfr3hu4602/wt(expando mutant);Tg(fli1a:egfp)y1 embryos using anti-znp1 antibody. Arrowheads and arrows indicate the presence or absence of axons beneath the dorsal aorta, respectively. Note that the TD is absent in the expando mutant. Scale bar: 25 μm. DA, dorsal aorta; TD, thoracic duct.