
Fig. 2
- ID
- ZDB-IMAGE-131210-23
- Genes
- Publication
- Zhen et al., 2013 - Hemogenic endothelium specification and hematopoietic stem cell maintenance employ distinct Scl isoforms
- All Figures
- Figures for Zhen et al., 2013
|
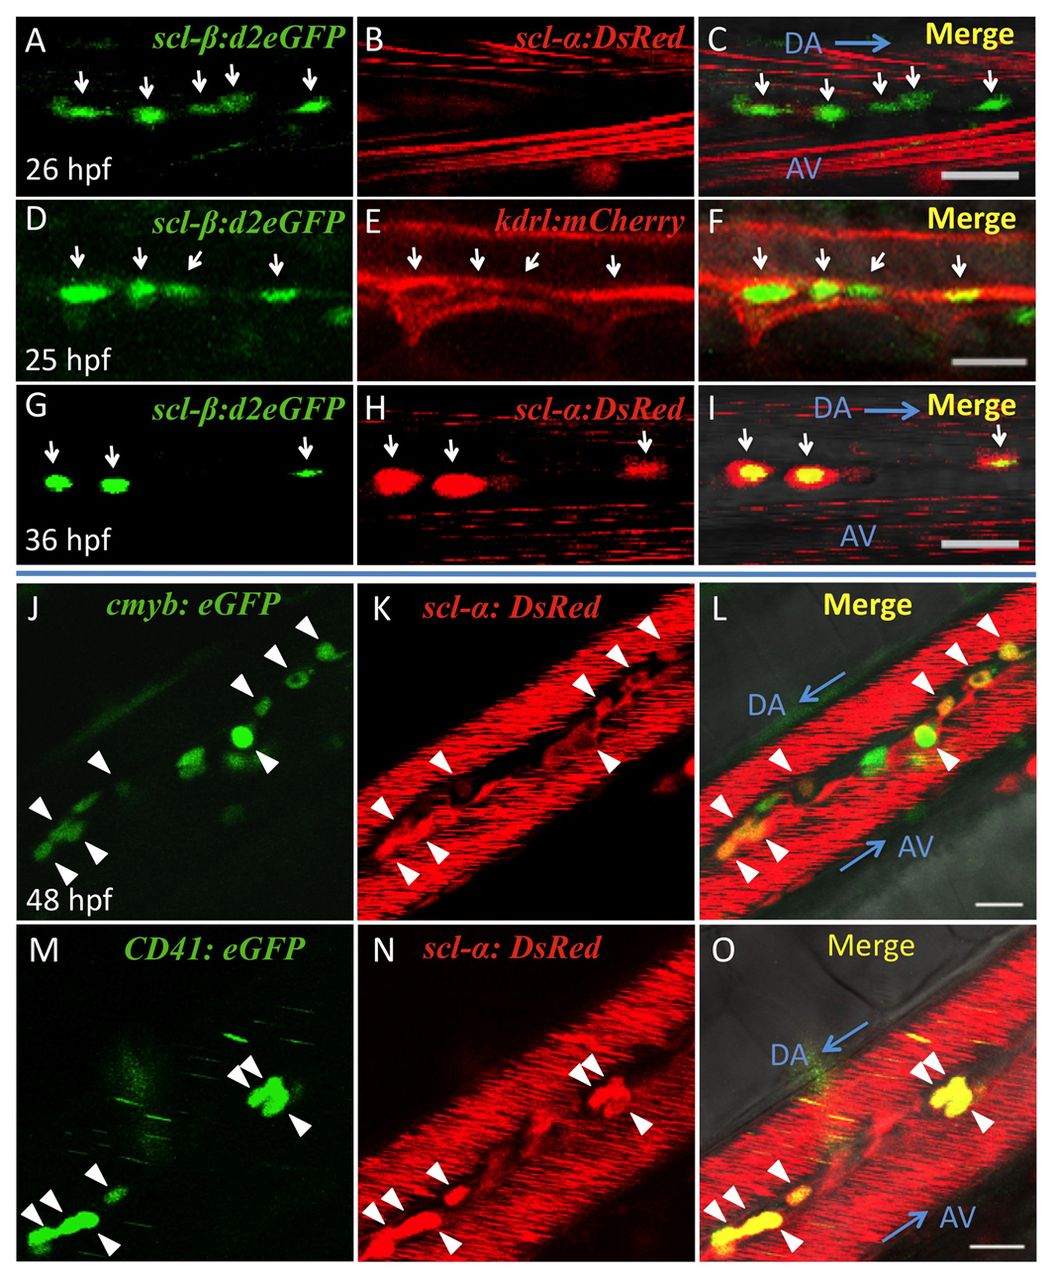
Fig. 2 Expression of scl-β and of scl-α in the AGM represent two sequential cell populations. (A-C) Expression of fluorescent proteins in the AGM of a 26 hpf Tg(scl-β:d2eGFP; scl-α:DsRed) zebrafish embryo. The scl-β:d2eGFP signals were detected lining the ventral side of the dorsal aorta, whereas expression of scl-α:DsRed was absent. (D-F) Expression of fluorescent proteins in the AGM of a 25 hpf Tg(scl-β:d2eGFP; kdrl:Ras-mCherry) embryo. scl-β:d2eGFP was co-expressed with kdrl:Ras-mCherry in endothelial cells. (G-I) Expression of fluorescent proteins in the AGM of a 36 hpf Tg(scl-β:d2eGFP; scl-α:DsRed) embryo. The scl-β:d2eGFP and scl-α:DsRed signals overlapped in the forming HSCs. Arrows in A-I indicate the cells in the AGM that express the corresponding fluorescent proteins. (J-O) cmyb or CD41 (itga2b) is co-expressed with scl-α in AGM HSCs (arrowheads) of 48 hpf live Tg(cmyb:eGFP; scl-α:DsRed) embryos or 56 hpf live Tg(CD41:eGFP; scl-α:DsRed) embryos. Blue arrows indicate the direction of circulation. The red stripes in vessels are due to the rapid confocal scanning of circulating scl-α:DsRed+ red blood cells. DA, dorsal aorta; AV, axial vein. Scale bars: 20 μm.