Image
Figure Caption
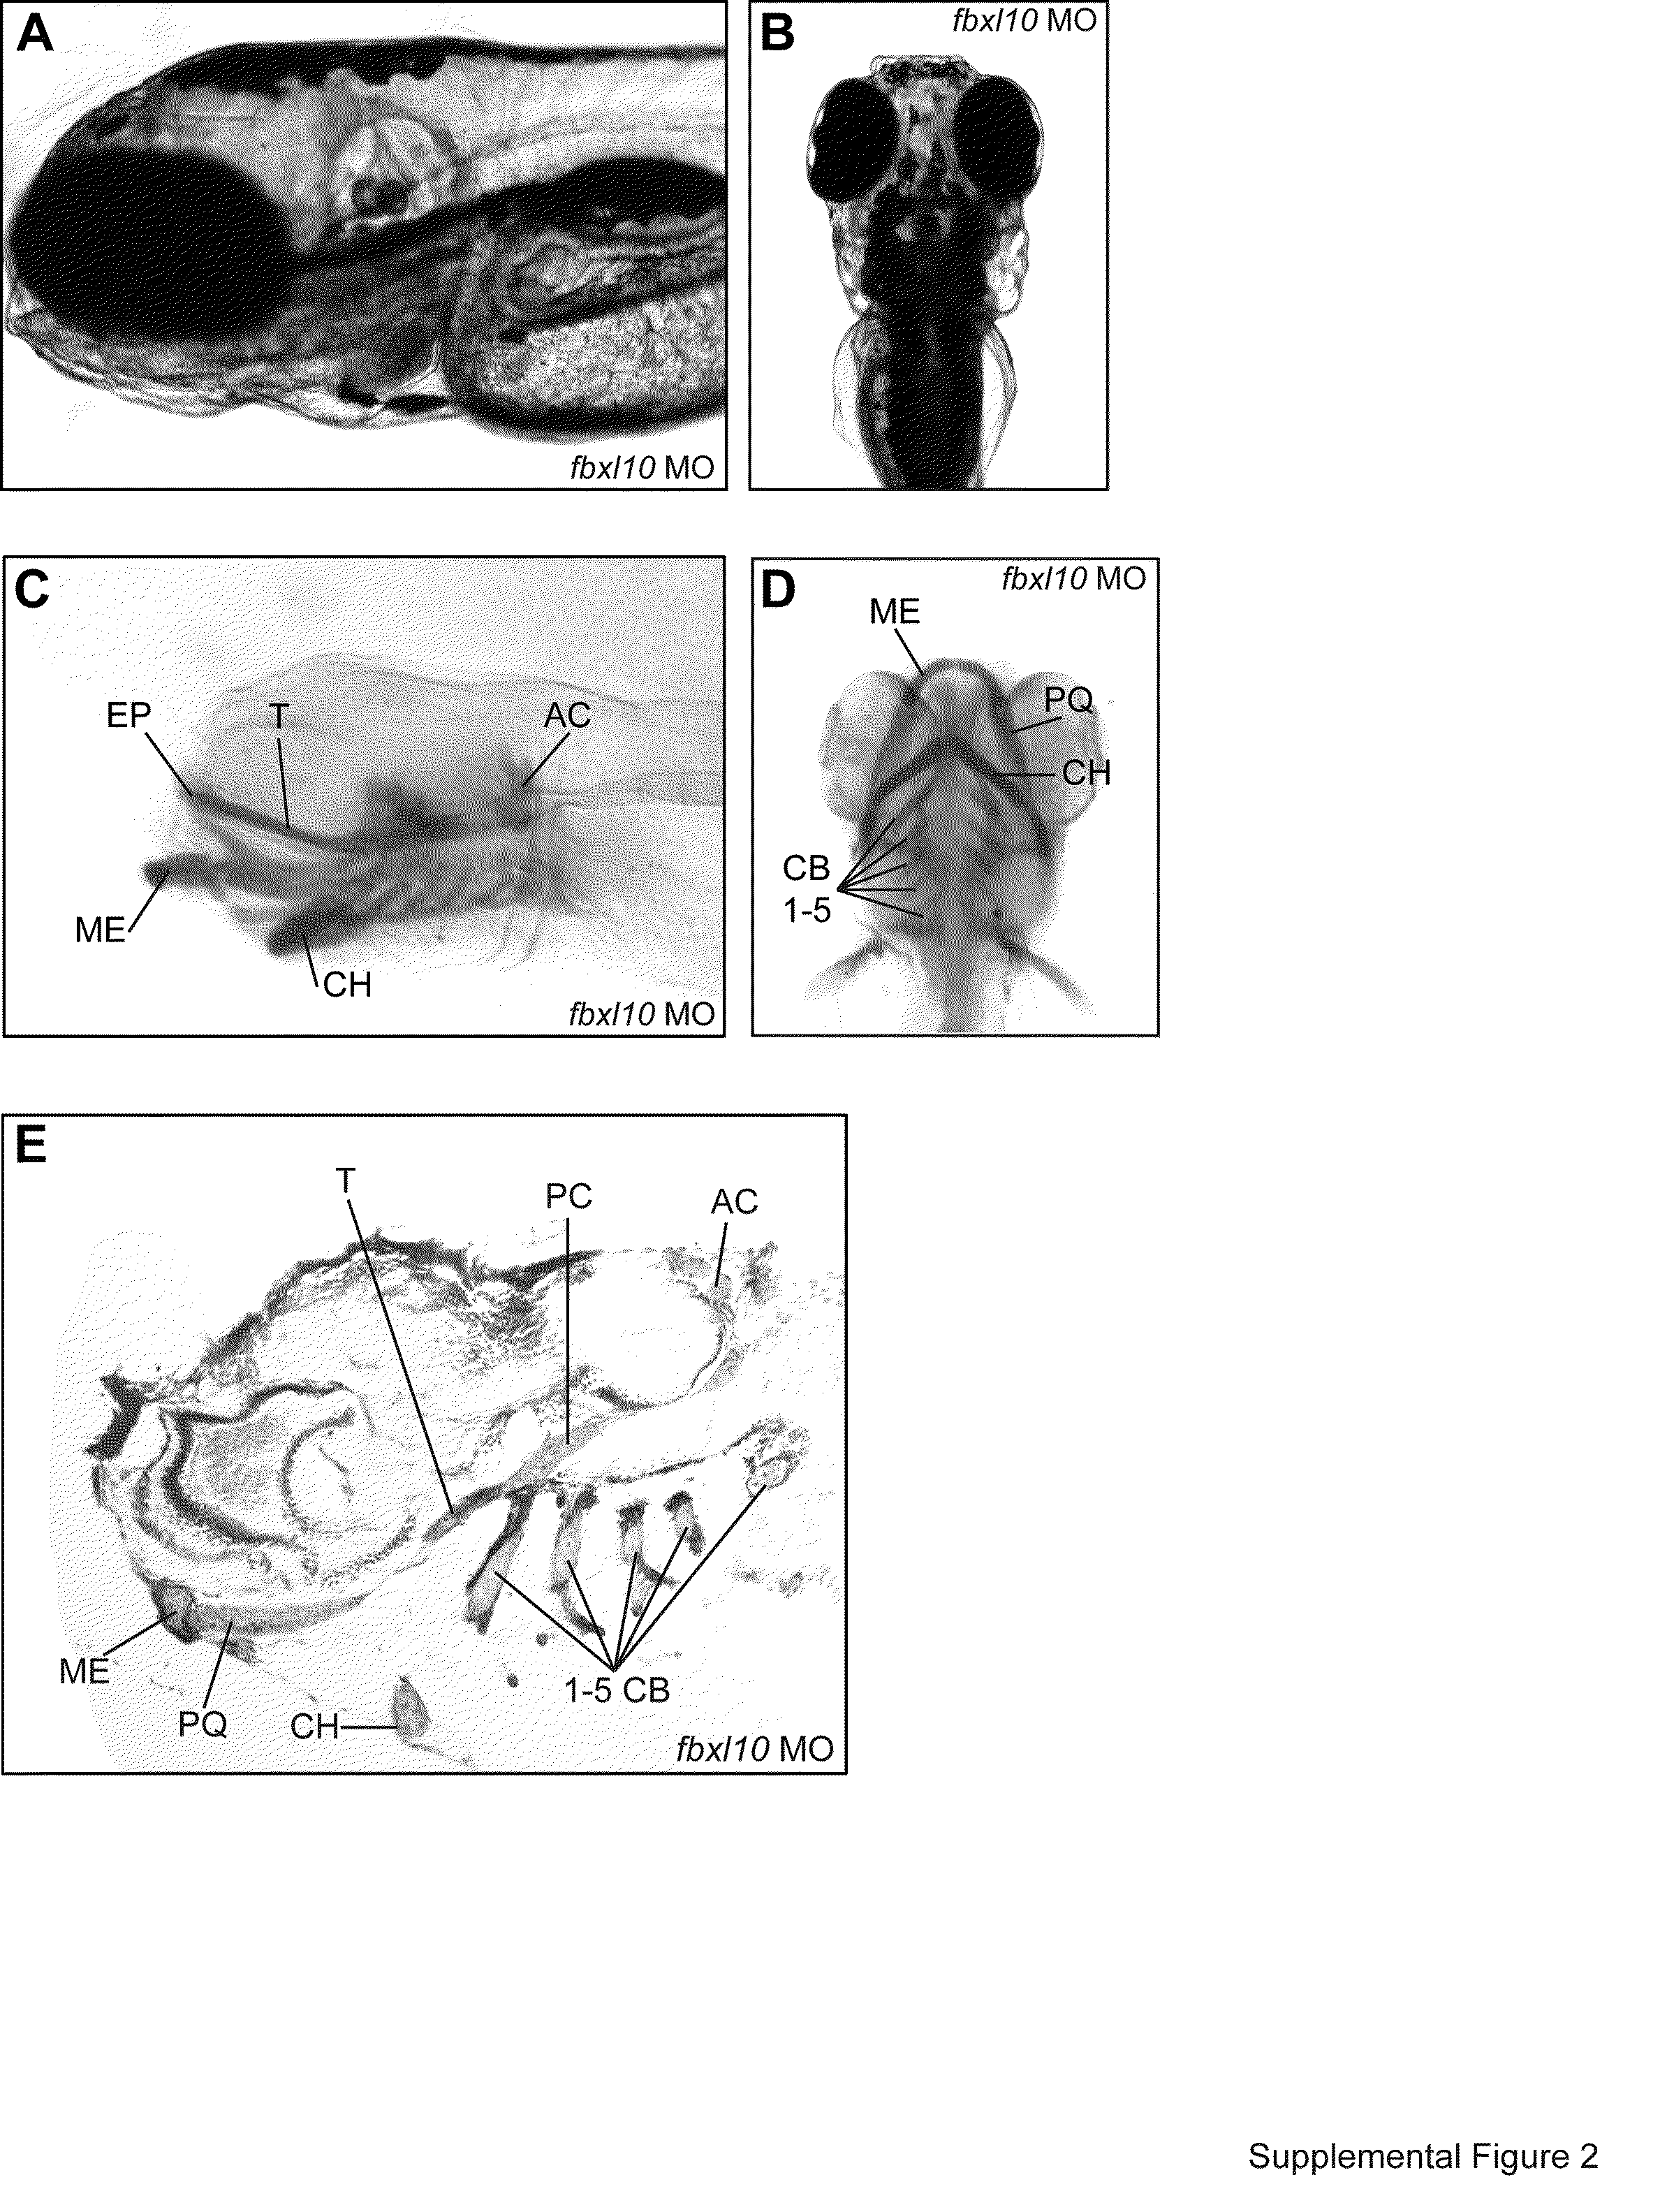
Fig. S2 Modulation of fbxl10 expression results in normal development of gross anatomical and craniofacial structures. (A–B) Lateral and dorsal bright-field images of 4 dpf fbxl10 morphants.(C–D) Whole-mount lateral and ventral representative images of fbxl10 morphant craniofacial structure. (E) Sagittal sectioning of Alcian blue stained craniofacial cartilage in a representative fbxl10 morphant. AC=auditory capsule, CB=ceratobranchial, CH=ceratohyal, ME=Meckel′s cartilage, PC=parachordal, PQ=palatoquadrate, and T=trabeculacranii.
Figure Data
Acknowledgments
This image is the copyrighted work of the attributed author or publisher, and
ZFIN has permission only to display this image to its users.
Additional permissions should be obtained from the applicable author or publisher of the image.
Reprinted from Developmental Biology, 382(1), Balow, S.A., Pierce, L.X., Zentner, G.E., Conrad, P.A., Davis, S., Sabaawy, H.E., McDermott, B.M., and Scacheri, P.C., Knockdown of fbxl10/kdm2bb rescues chd7 morphant phenotype in a zebrafish model of CHARGE syndrome, 57-69, Copyright (2013) with permission from Elsevier. Full text @ Dev. Biol.

