
|
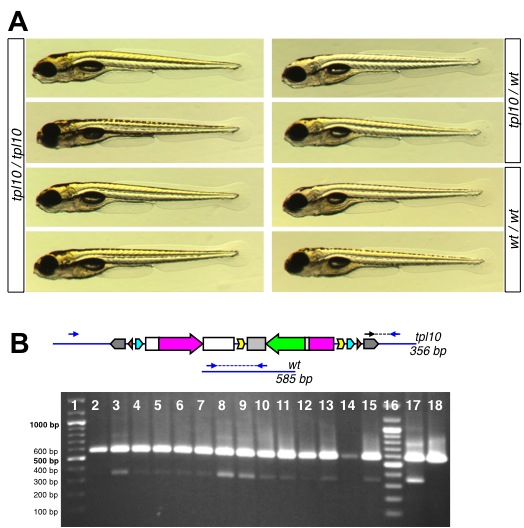
Fig. S5 Late larval lethality of atp1a3atpl10 homozygotes. A. 5 dpf larvae homozygous for atp1a3atpl10 do not display overt embryonic phenotypes compared to heterozygous and wild type embryos. B. Genotyping of adult fish raised from atp1a3atpl10 incross embryos selected for GFP fluorescence. Diagrams on the top represent the tpl10 gene trap allele and wild type allele with expected sizes of PCR bands indicated. Genomic primers flanking transposon integration (Atp1a3a.9A1c.F and Atp1a3a.9A1A.R) are depicted as blue arrows, transposon-specific primer Tol2-R5 is depicted as a black arrow. PCR bands are shown as blue (wild type) and black (gene trap allele) dashed lines. Short PCR extension time does not allow amplification across GBT-B1. Below the diagram is a picture of a genotyping gel. Lanes 1 an 16, DNA ladder (Thermofisher Fermentas Cat #SM0331, sizes of relevant bands indicated to the left). Lanes 2–15 are PCR reactions on DNA from individual tailclips. Lanes 17 and 18 are PCR reactions performed on DNA from pools of GFP-positive (lane 17) and GFP-negative (lane 18) embryos.