
|
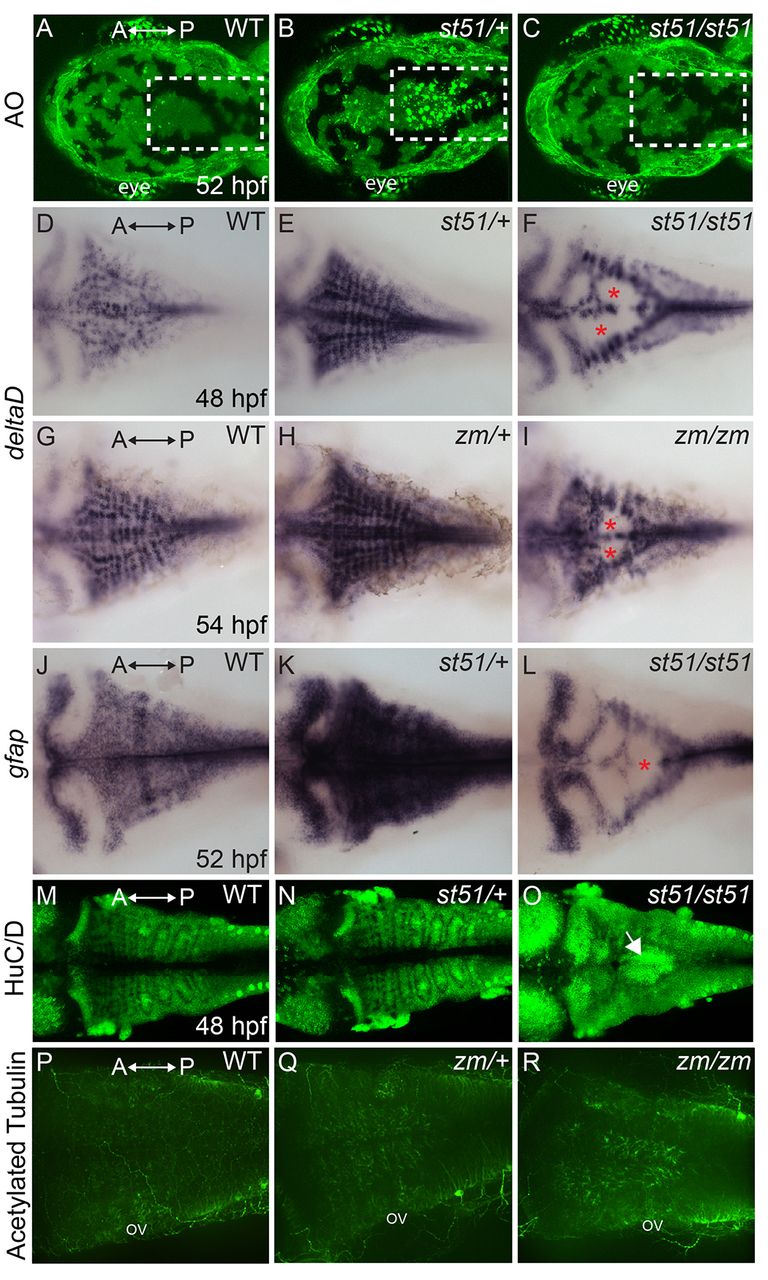
Fig. 3
Apoptosis in notch3 heterozygotes and neurogenic phenotype of notch3 mutants. (A–C) Acridine orange (AO)-labeled embryos. The hindbrains (white dashed areas) of (A) wild type (WT) and (C) notchst51/st51 mutants were largely devoid of AO-positive cells at 52 hpf. In contrast, AO-positive cells were abundant in the hindbrain region of (B) notch3 heterozygotes. (D–I) Dorsal views of deltaD expression. (D,G) In wild type, deltaD mRNA was abundant in the CNS. deltaD expression was more pronounced in (E) notch3st51/+ and (H) notch3zm/+ heterozygotes. deltaD expression was robust in lateral regions and showed gaps in medial regions (asterisks) of (F) notch3st51/st51 and (I) notch3zm/zm mutants. (J,K) Expression of another progenitor marker, gfap, which marks neural progenitor cells, was more robust in (K) notch3st51/+ heterozygotes compared with in (J) wild type. (L) In notch3st51/st51 mutants, gfap was present in lateral regions and showed medial gaps (asterisk). (M–O) HuC/D, a marker of post-mitotic neurons, expression was comparable in (M) wild type and (N) notch3st51/+ heterozygotes, but was more robust in the medial hindbrain (arrow) of notch3st51/st51 mutants. (P-R) Acetylated-tubulin-labeled (P) wild-type (n=5), (Q) notch3zm/+ heterozygotes (n=11) and (R) notch3zm/zm mutant (n=9) larvae. (P-R) Max projections of confocal images. ov, otic vesicle. All panels are dorsal views, anterior (A) is to the left and posterior (P) is to the right.