
|
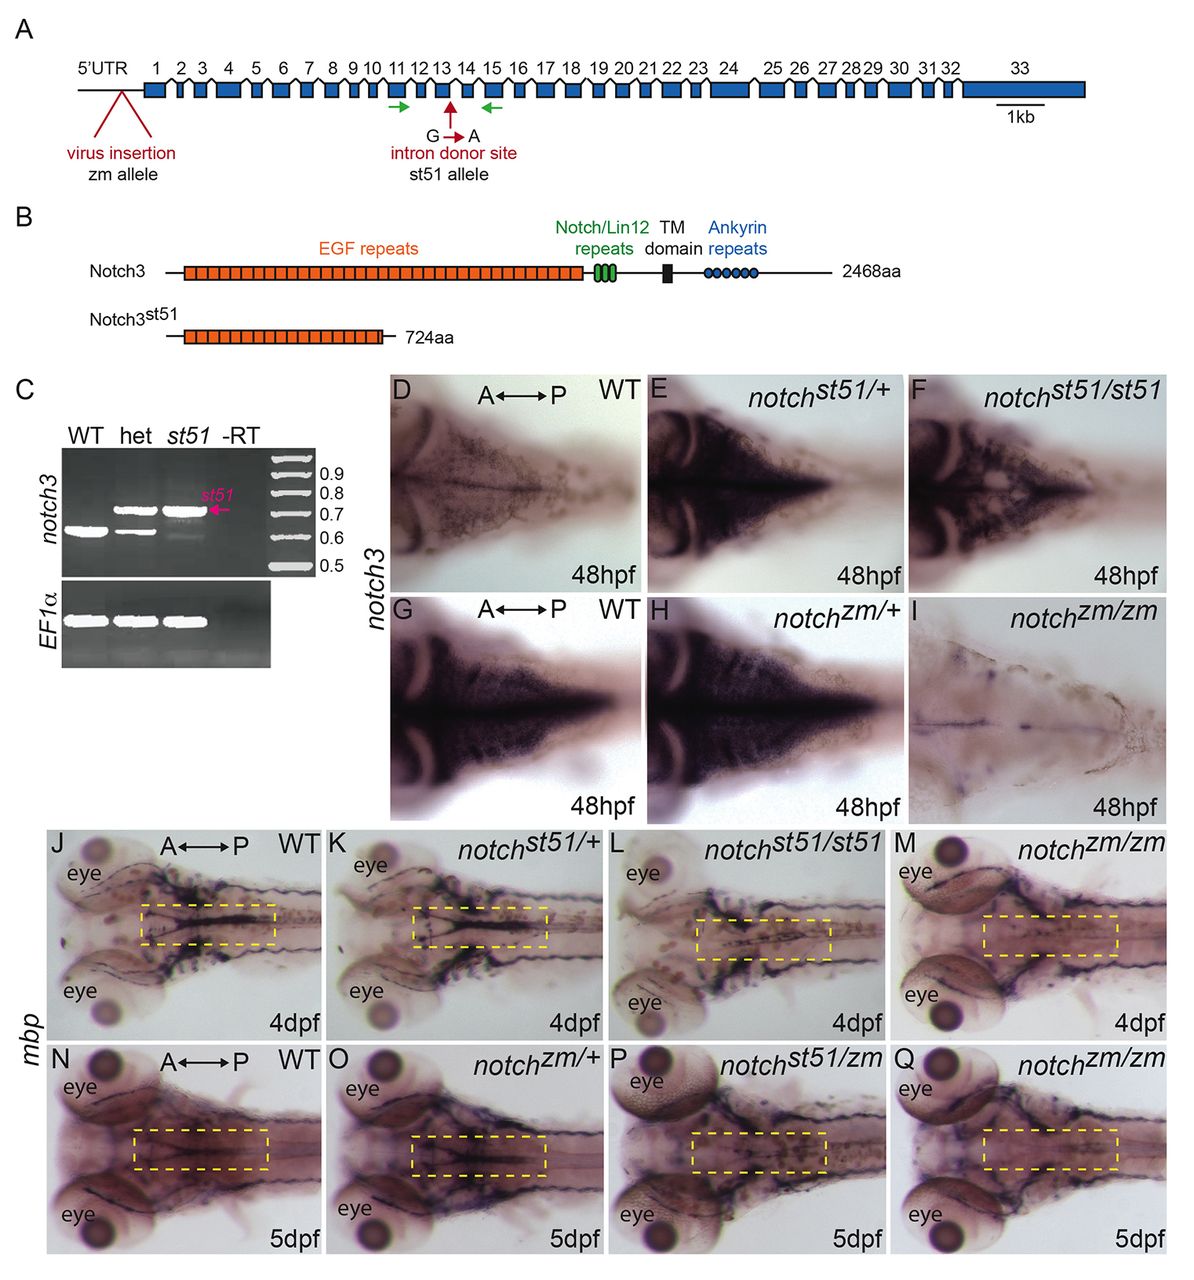
Fig. 1
Mutations in notch3 reduce mbp mRNA expression. (A) Schematic depicting the notch3 gene and the locations of the retroviral insertion (zm allele) and of the st51 mutation. Introns are not to scale. (B) Schematic of the wild-type Notch3 protein domains and the truncated protein produced owing to the st51 mutation. (C) RT-PCR of the wild-type (WT) and st51 notch3 transcripts. (D–I) In (D,G) wild-type zebrafish, (E) notch3st51/+ and (H) notch3zm/+ heterozygotes, and (F) notch3st51/st51 mutants, notch3 transcripts were detected in the CNS. In contrast to heterozygotes and notch3st51/st51 mutants, notch3 expression was barely detectable in the CNS of (I) notch3zm/zm mutants. Panels D–F and G–I are age-matched siblings from st51 and zm clutches, respectively. (D–F) Short staining reaction. (G–I) Long staining reaction. (J–Q) Expression of mbp was similar in (J,N) wild-type zebrafish and (K,O) notch3st51/+ or notch3zm/+ heterozygotes, but was reduced in the CNS (compare yellow dashed areas in the hindbrain) of (L) notch3st51/st51 and (M,Q) notch3zm/zm homozygotes and (P) notch3st51/zm transheterozygotes, indicating that the st51 and zm mutations failed to complement. (D–Q) Dorsal views. Anterior (A) and posterior (P) are indicated.