
|
Fig. 3
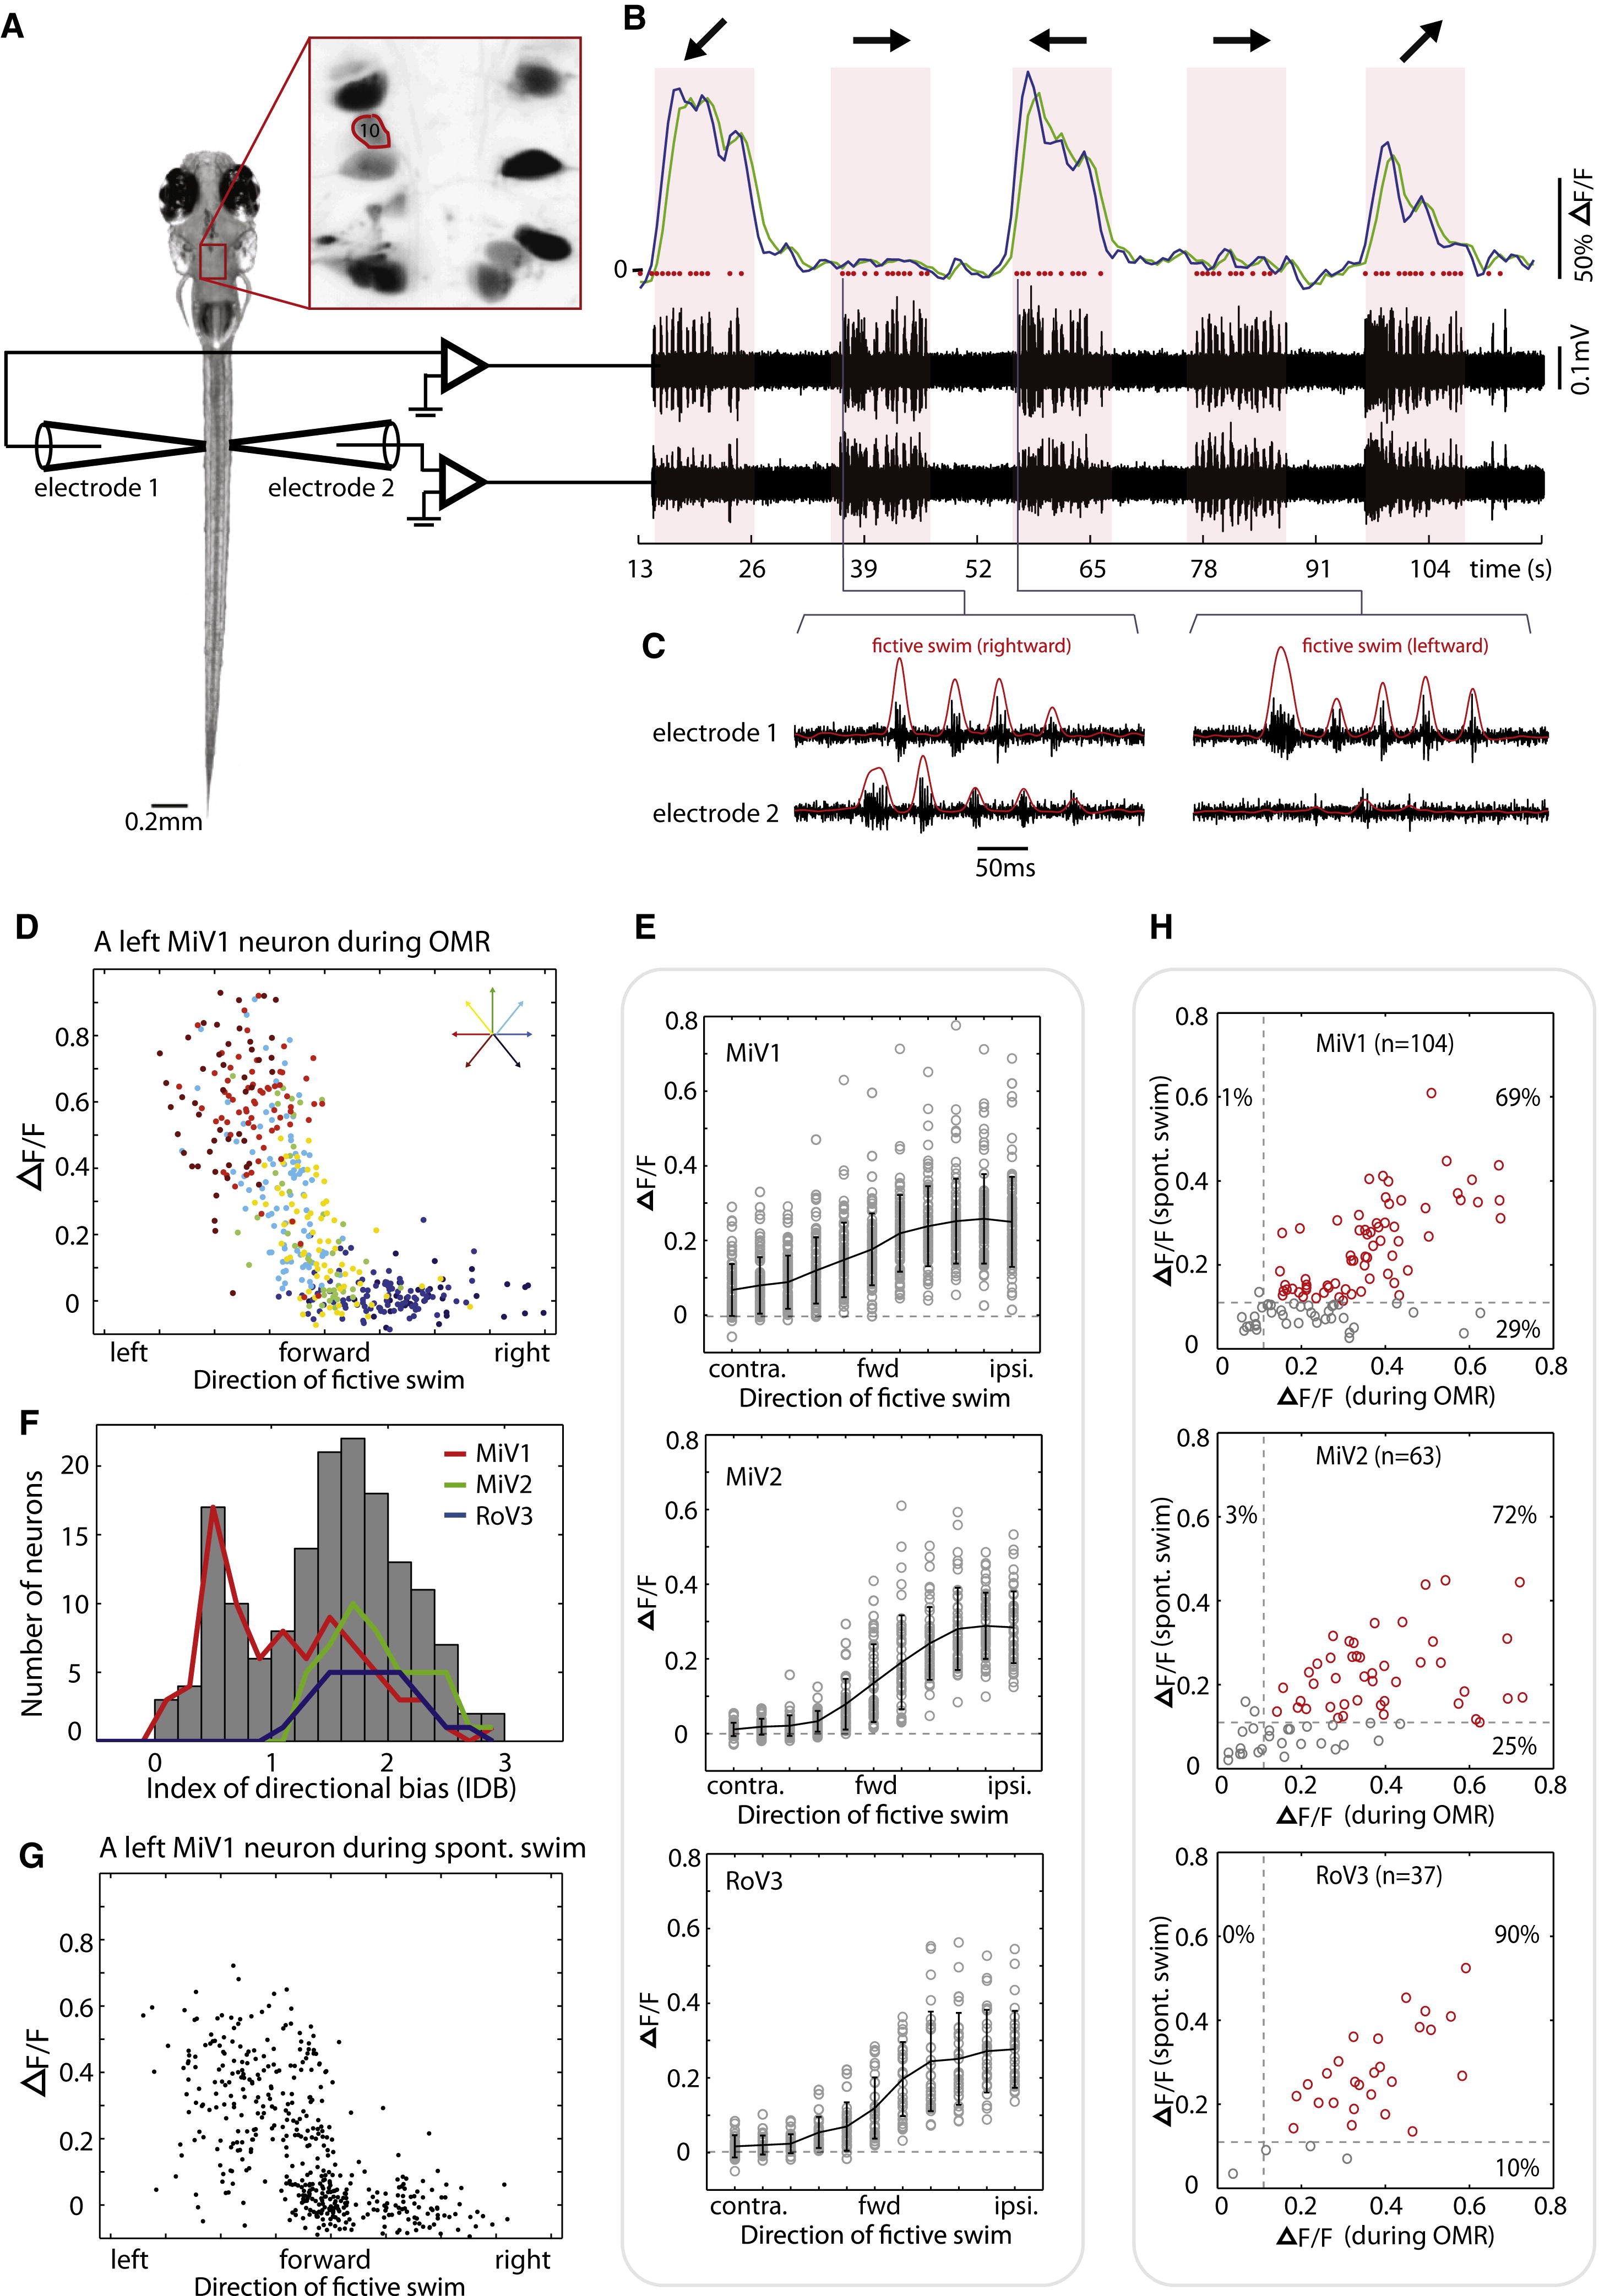
vSPNs Show Graded Responses with Respect to Turn Angle and Show Correlated Activity for Visually Evoked and Spontaneously Occurring Swim Events
(A) Simultaneous recordings of motor nerve signals and hindbrain neuron activity reported by calcium imaging.
(B) A left MiV1 cell (marked “10” in inset of A) backfilled with calcium green dextran responds strongly to left and backward left gratings and weakly to a forward right grating. Region-of-interest averaged fluorescence time series is shown in green, and the deconvolved trace is shown in blue. Motor nerve activity (black traces) was recorded bilaterally to identify fictive swims (red dots).
(C) Motor nerve signals shown at higher resolution. Examples of a right turn (left panel) and a left turn (right panel) are shown.
(D) Fluorescent calcium response (ΔF/F) of a MiV1 neuron as a function of swimming direction. Each dot represents a discrete swimming event, and the color indicates the visual stimulus used to elicit the swim. The cell exhibits a rectifying-shaped activation profile.
(E) Activation profile of the three nuclei (83, 47, and 29 neurons in MiV1, MiV2, and RoV3 nuclei, respectively). Swim direction was divided into 11 bins, and each circle indicates the average ΔF/F of a neuron in the swim direction. Error bars represent SD. Only responsive neurons are analyzed (ΔF/F > 0.12; MiV1, 83 of 104 cells; MiV2, 47 of 63 cells; RoV3, 29 of 37 cells).
(F) Analysis of the directional bias of all vSPNs reveals two functional groups.
(G) Calcium responses of the same neuron shown in (D) during spontaneous fictive swimming. The same rectifying shape is apparent.
(H) The majority of the vSPNs that are active during the OMR are also active during spontaneous swimming. Each circle represents a neuron. A threshold of ΔF/F > 0.12 (dashed lines) is used to define active cells. Neurons above thresholds are shown in red; neurons below thresholds are shown in gray.
See also Figures S3 and S4.