
|
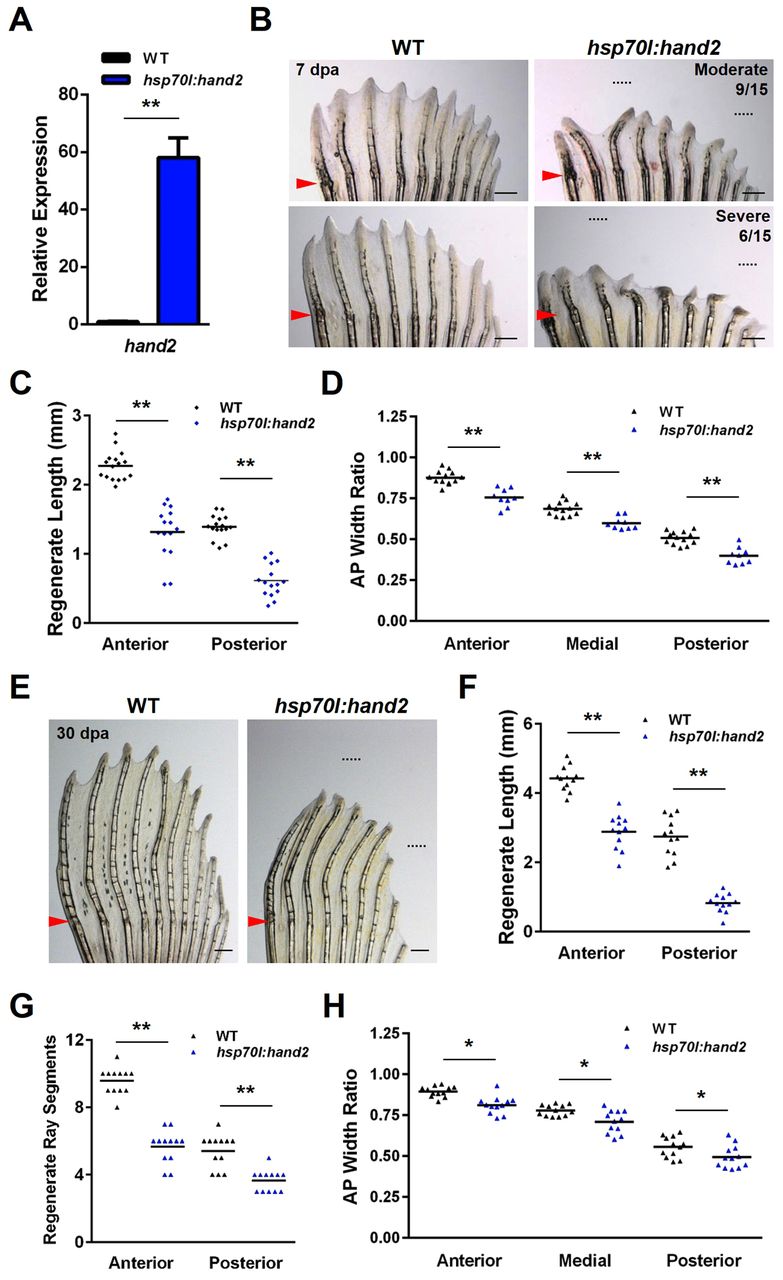
Fig. 3
Overexpression of hand2 during fin regeneration alters ray patterning. (A) hand2 expression is induced 58-fold in anterior regions of hsp70l:hand2 pectoral fins 4 hours after a single heat shock at 4 dpa. Values are normalized to actb1 levels and relative to wild-type controls. n=3; mean ± s.e.m. (B) Appearance of hsp70l:hand2 and wild-type clutchmate fins at 7 dpa after a series of daily heat shocks. hand2 overexpression generates shorter rays with a reduced number of bone segments. Phenotypes range from moderate (upper right) to severe (lower right). Representative regenerative growths of wild-type rays 3 and 8 are denoted by dotted lines. (C) Overexpression of hand2 reduces the lengths of regenerating rays across the AP axis of pectoral fins. n=16 (wild type) and n=15 (hsp70l:hand2). (D) Overexpression of hand2 during regeneration reduces the widths of regenerating fin rays across the AP axis. Transgenic fish that displayed a moderate phenotype were quantified. n=13 (wild type) and n=6 (hsp70l:hand2). (E) Appearance of hsp70l:hand2 and wild-type clutchmate fins at 30 dpa after daily heat shocks. hsp70l:hand2 regenerates remain stunted with shorter and thinner fin rays. Representative regenerative growths of wild-type rays 3 and 8 are denoted by dotted lines. (F) Quantification of hsp70l:hand2 ray lengths at 30 dpa. n=12. (G) Quantification of hsp70l:hand2 segment numbers at 30 dpa. n=12. (H) Quantification of hsp70l:hand2 ray widths at 30 dpa. n=12. *P<0.05, **P<0.005, Student’s t-test; bar indicates mean. Arrowheads (B,E) indicate amputation plane. Scale bars: 0.5 mm.