
|
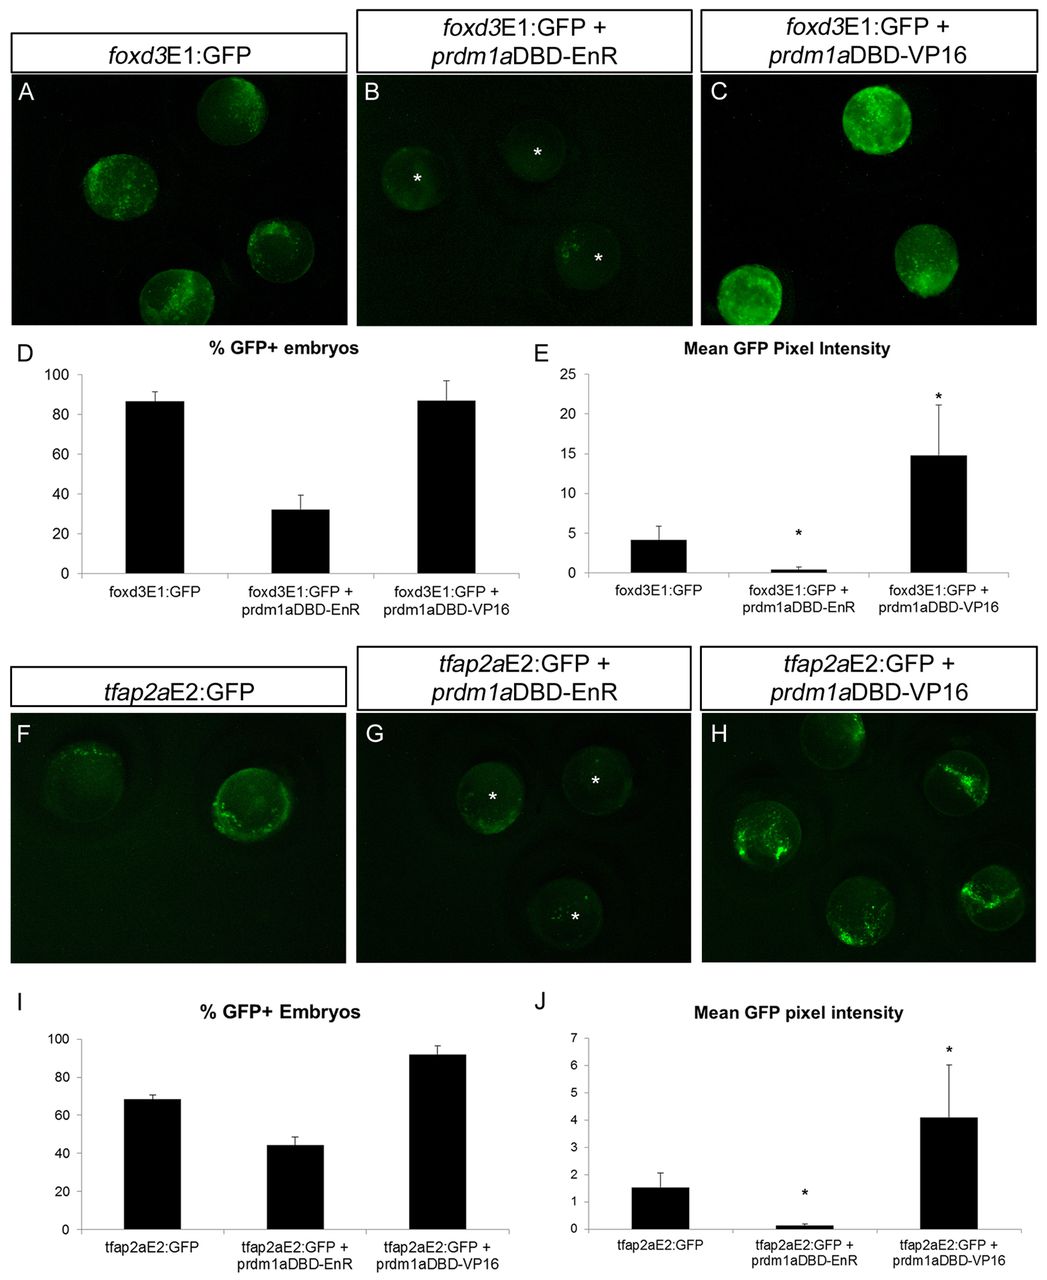
Fig. 6
Prdm1a dominant activator and dominant repressor constructs directly regulate foxd3 and tfap2a enhancers. (A-C) Zebrafish embryos at the 2-somite stage expressing foxd3E1:GFP alone (A) or with prdm1aDBD-EnR dominant repressor (B) or prdm1aDBD-VP16 dominant activator (C). GFP expression is downregulated when foxd3E1:GFP is co-injected with prdm1aDBD-EnR (asterisks) and upregulated when the enhancer construct is co-expressed with prdm1aDBD-VP16. (D,E) The percentage of embryos expressing GFP (D) and GFP pixel intensity (E) in A-C. (D) foxd3E1:GFP, n=19/22; EnR, n=6/19; VP16, n=28/32. (E) foxd3E1:GFP, n=17; EnR, n=10; VP16, n=10. (F-H) Two-somite embryos expressing tfap2aE2:GFP with prdm1aDBD-EnR also exhibit downregulated GFP (G, asterisks), whereas when co-expressed with prdm1aDBD-VP16 they display increased GFP expression (H). (I,J) Percentage of GFP-positive embryos (I) and GFP pixel intensity (J) in F-H. (I) tfap2aE2:GFP, n=11/16; EnR, n=16/36; VP16, n=36/39. (J) tfap2aE2:GFP, n=11; EnR, n=14; VP16, n=12. *P<0.05. Error bars indicate s.e.m.