
|
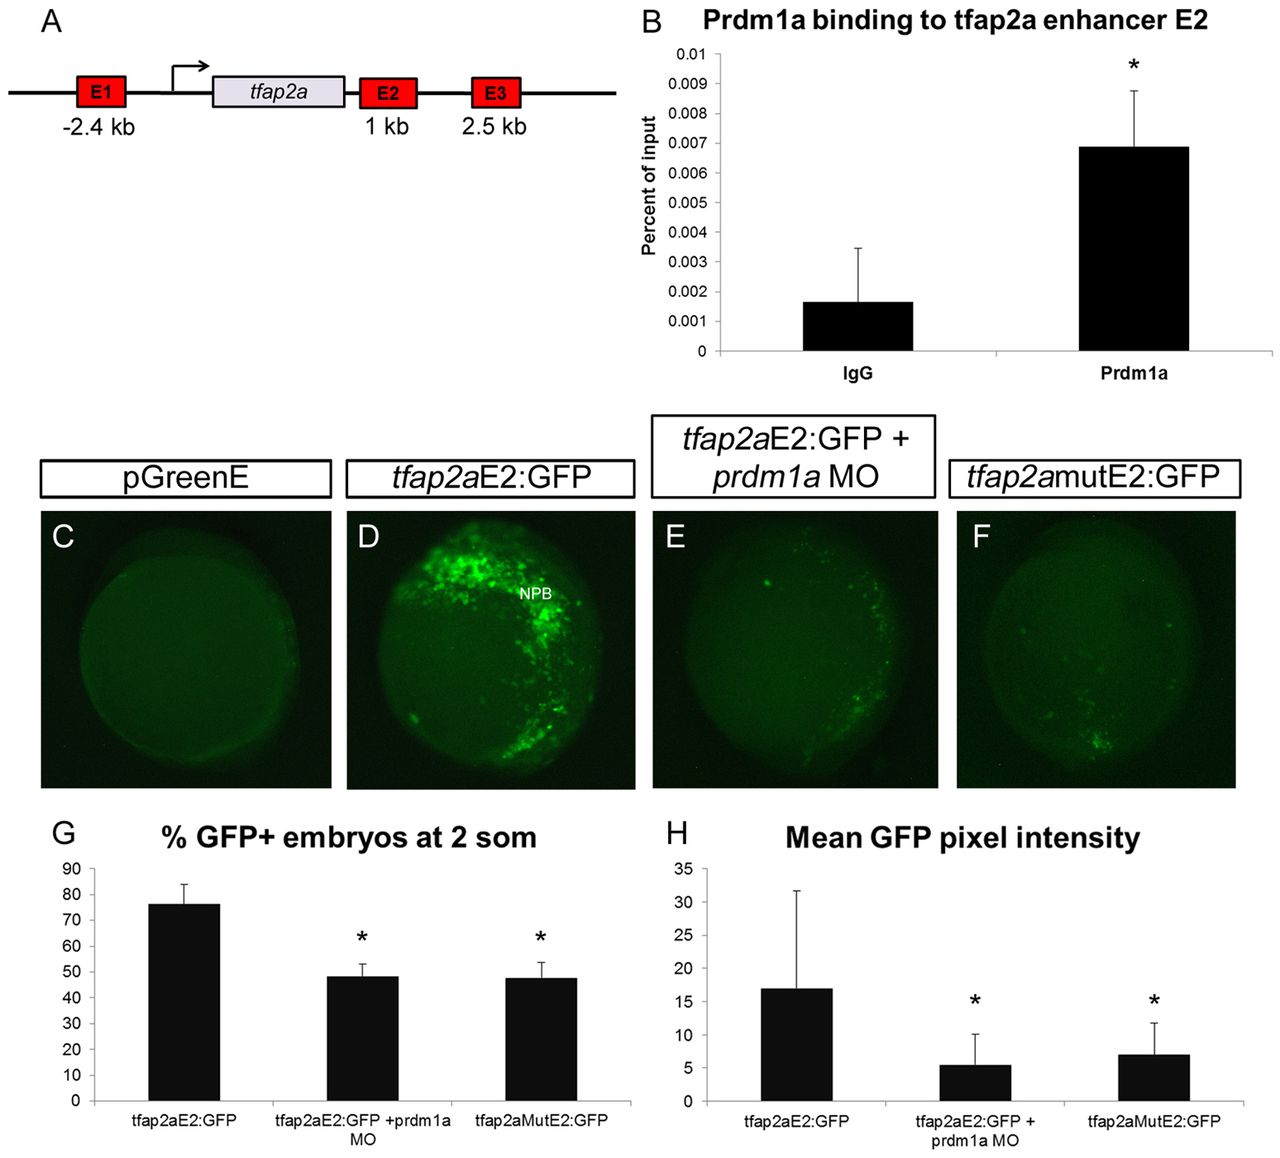
Fig. 5
Prdm1a directly binds and activates a tfap2a enhancer at the NPB. (A) The zebrafish tfap2a locus showing the three putative enhancers E1, E2 and E3 (distance from the tfap2a transcription start site is indicated) that contain Prdm1a binding sequences and were analyzed by ChIP. (B) Prdm1a ChIP pulls down tfap2a E2, which is enriched compared with IgG. (C-F) Two-somite embryos injected with pGreenE GFP expression plasmid (C), tfap2aE2 driving GFP as construct tfap2aE2:GFP (D), tfap2aE2:GFP with prdm1a-MO (E), and tfap2aE2 with a mutated Prdm1a binding site driving GFP as construct tfap2amutE2:GFP (F). Specific binding of Prdm1a to an enhancer for tfap2a is illustrated. (G,H) The percentage of embryos expressing GFP (G) and the average pixel intensity of GFP (H). (G) tfap2aE2:GFP, n=55/68; tfap2aE2:GFP + prdm1a-MO, n=43/88; tfap2aE2mut:GFP, n=47/100. (H) tfap2aE2:GFP, n=23; tfap2aE2:GFP + prdm1a-MO, n=14; tfap2aE2mut:GFP, n=10. *P<0.05. Error bars indicate s.e.m.