
|
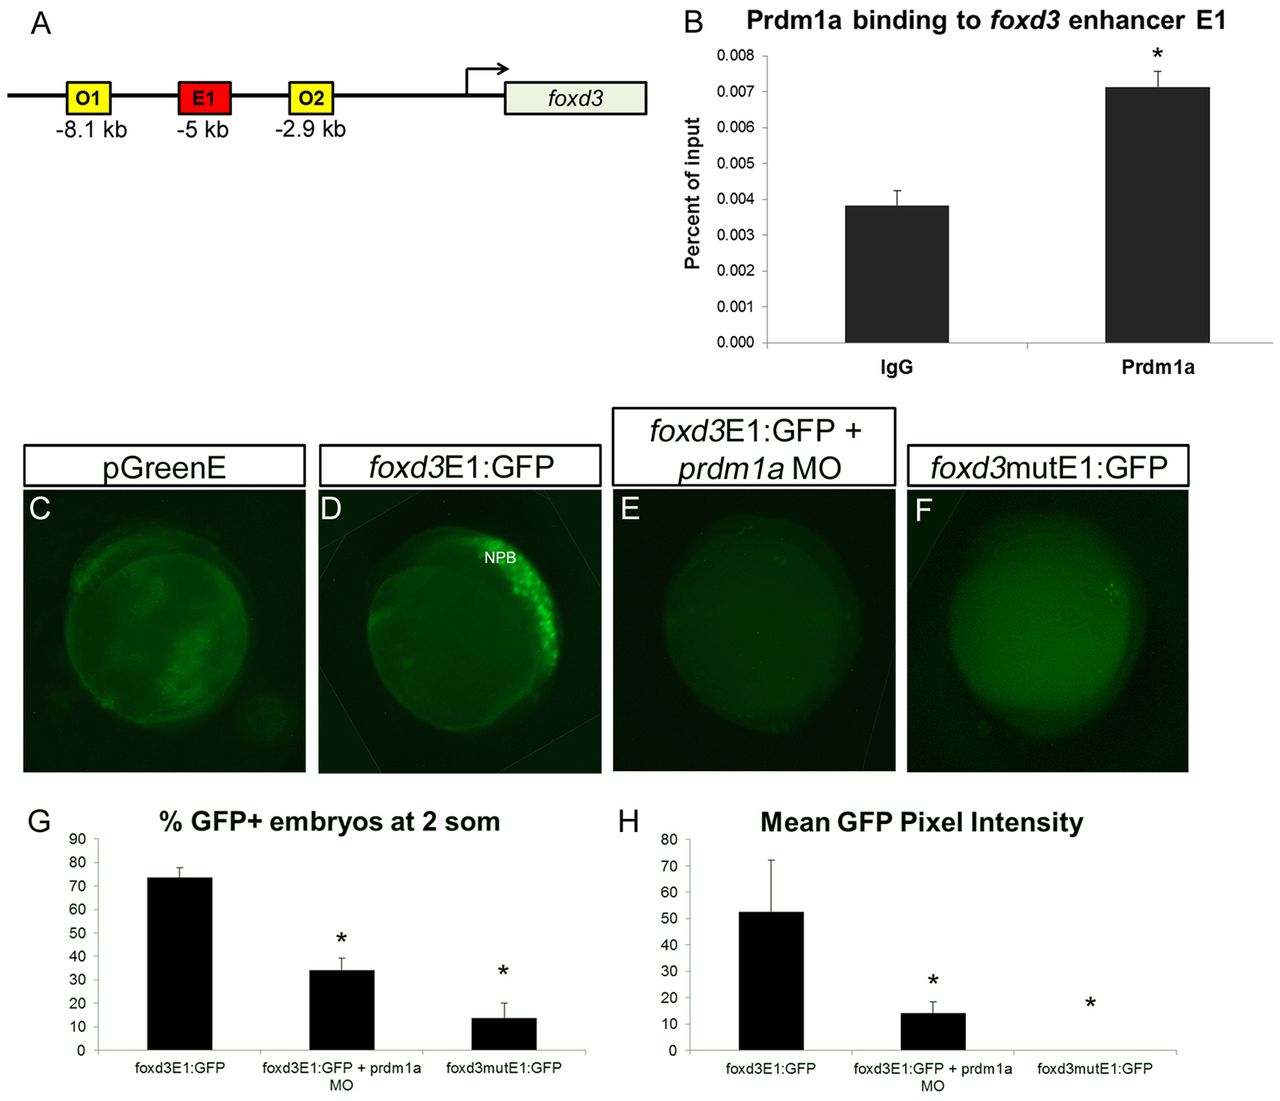
Fig. 3
Prdm1a directly binds and activates a foxd3 enhancer at the NPB. (A) The zebrafish foxd3 locus showing one putative enhancer (E1) <5 kb upstream from the transcription start site that contains a binding sequence for Prdm1a, as well as the two off-target sites O1 and O2 used for ChIP. (B) Prdm1a ChIP pulls down foxd3 E1, which is enriched compared with the control IgG pulldown. (C-F) Lateral view of embryos injected with empty (no enhancer sequence) pGreenE GFP expression vector (C), foxd3 enhancer construct foxd3E1:GFP (D), foxd3E1:GFP with prdm1a-MO (E), and the foxd3 enhancer with a mutated Prdm1a binding site driving GFP as construct foxd3mutE1:GFP (F). Specific binding of Prdm1a to the foxd3 enhancer E1 is illustrated. Lateral views, anterior to the top. (G,H) The percentage of embryos expressing GFP (G) and the average pixel intensity of GFP (H). (G) foxd3E1:GFP, n=161/227; foxd3E1:GFP + prdm1a-MO, n=32/102; foxd3mutE1:GFP, n=29/166. (H) n=10 per condition. *P<0.05. Error bars indicate s.e.m.