
Fig. 2
|
Fig. 2
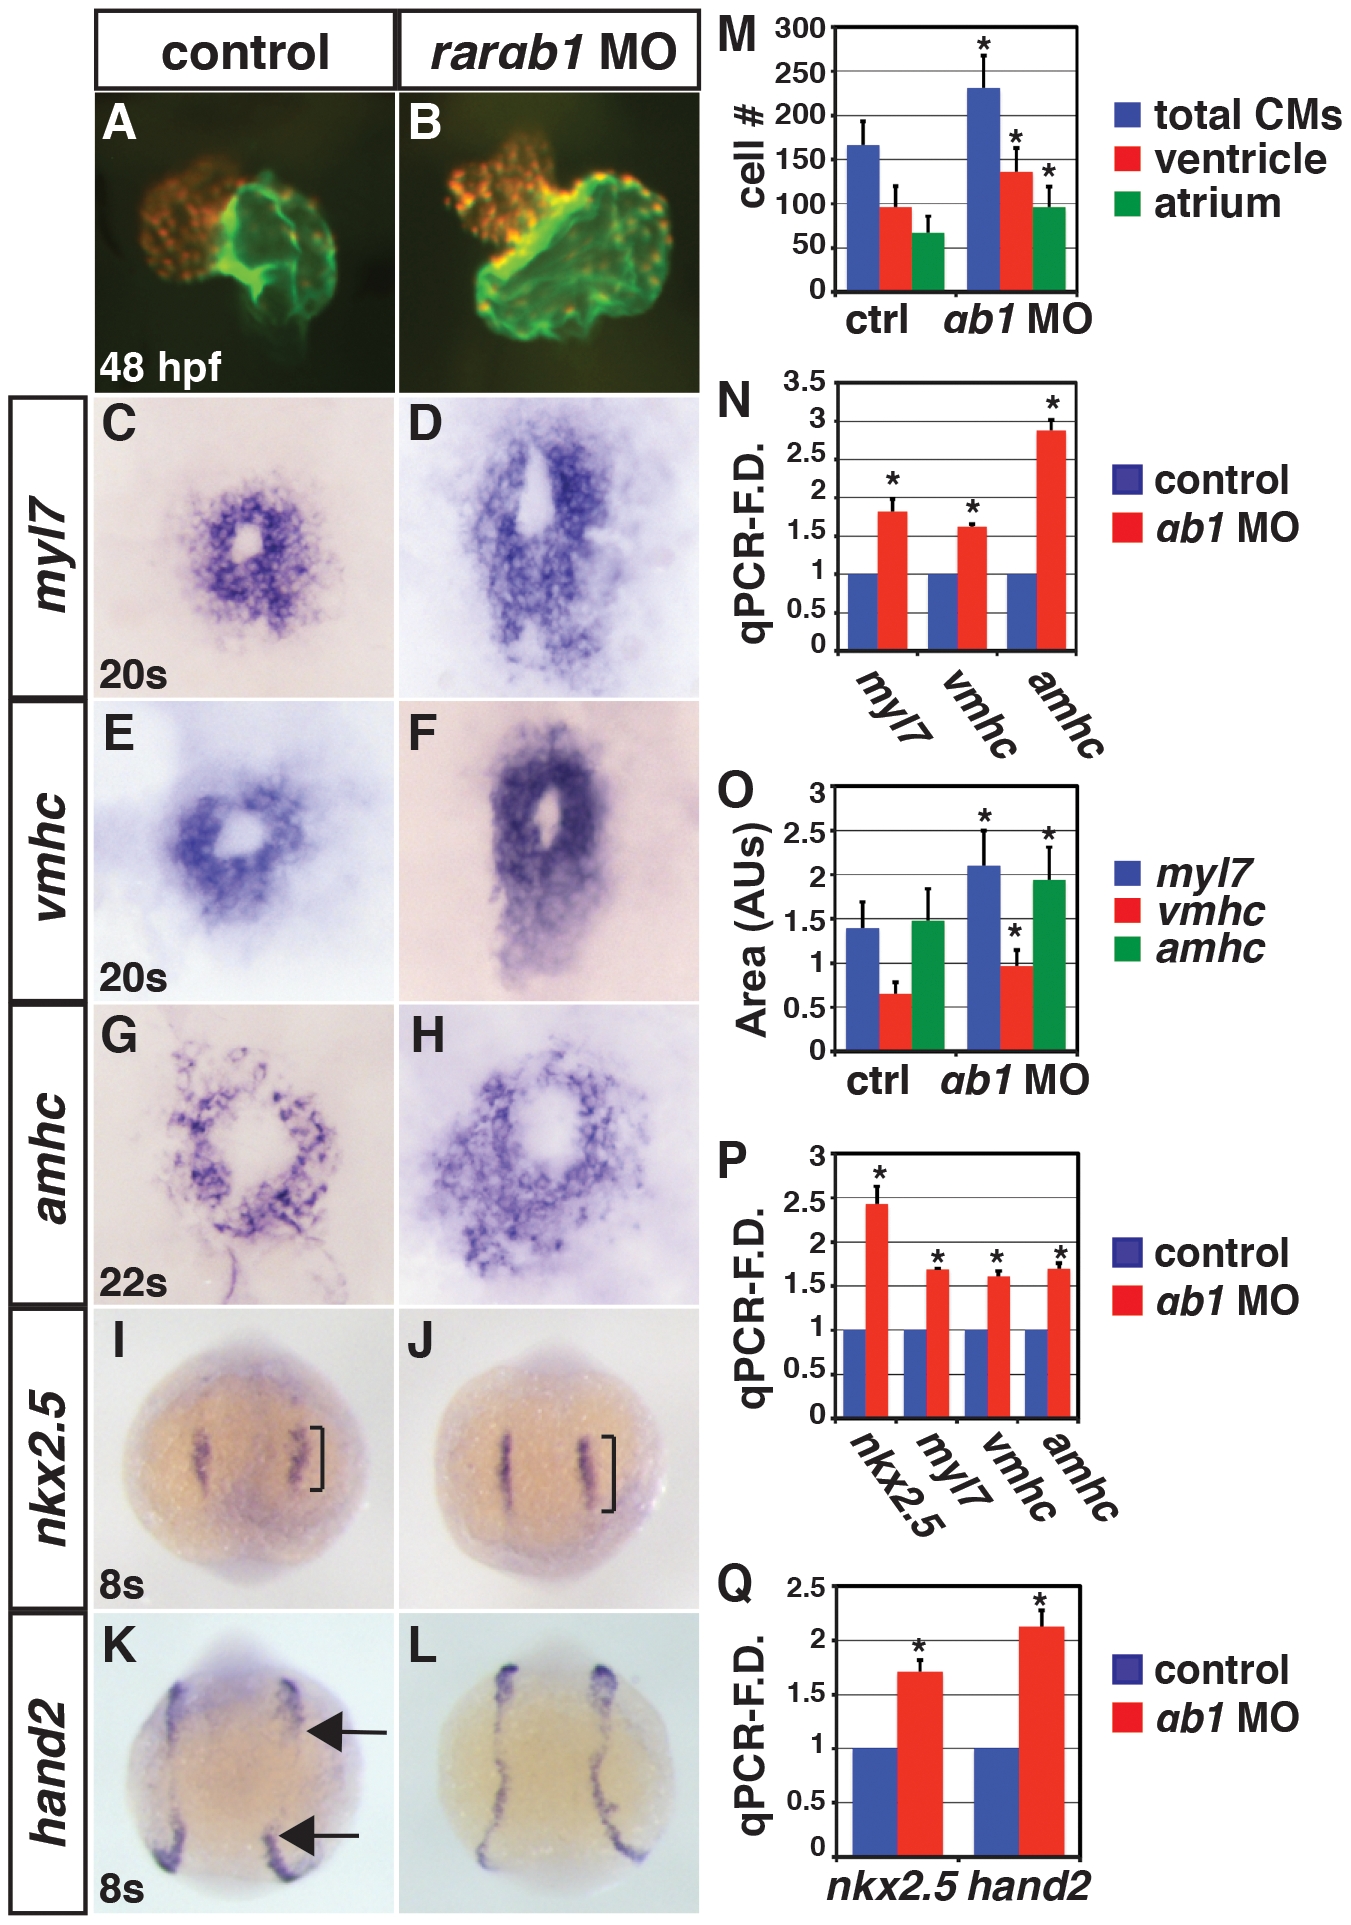
RARαb1 deficient embryos have enlarged hearts with increased CM number.
(A, B) Hearts from control sibling and RARαb1 deficient Tg(-5.1myl7:DsRed-NLS)f2 embryos. Images are frontal views. Red indicates ventricle. Green indicates atrium. (C–H) ISH for CM differentiation marker genes. (I–L) ISH for CM progenitor marker genes. Brackets in I and J indicate length of nkx2.5 expression. Arrows in K indicate posterior and anterior limits of the hand2 expression domains in the LPM. In C–L, views are dorsal with anterior up. (M) Mean CM number at 48 hpf. (N) qPCR for CM differentiation marker gene expression at 48 hpf. (O) Areas of the amount of cells expressing the CM differentiation marker genes at the 20 s and 22 s stages. (P) qPCR for CM differentiation marker gene and nkx2.5 expression at 24 hpf. (Q) qPCR for CM progenitor gene expression at the 8 s stage. Asterisk in all graphs indicate a statistically significant difference compared to controls (p<0.05). Error bars in all graphs indicate standard deviation.