
|
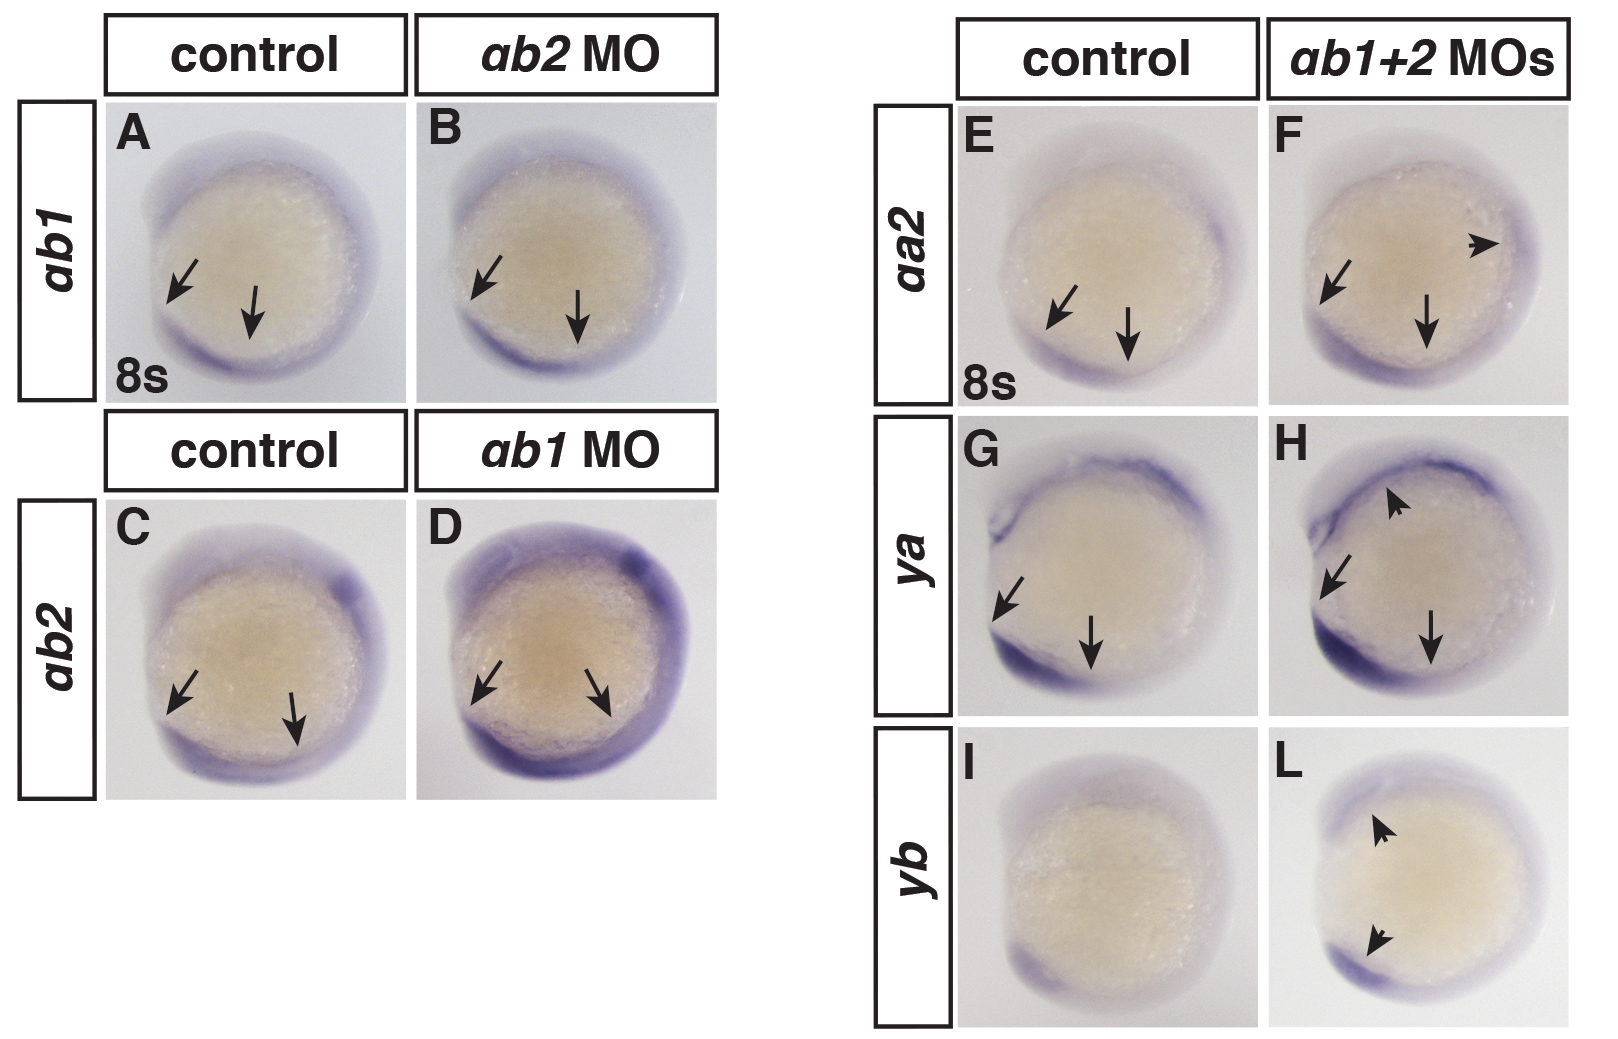
Fig. S12
Rar expression in RARαb1, RARαb2, or RARαb1+2 deficient embryos. (A, B) ISH for rarαb1 in RARαb2 deficient embryos. (C, D) ISH for rarαb2 in RARαb1 deficient embryos. (E, F) ISH for rarαa2 in RARαb1+2 deficient embryos. (G, H) ISH for rarγa in RARαb1+2 deficient embryos. (I, L) ISH for rarγb in Rarαb1+2 deficient embryos. rar expression is often expanded in the tailbud region of embryos deficient for the other RAR homologs, while additional regions also appear to have increased or low levels of ectopic expression. All views are lateral with dorsal right at 8 s. Arrows in A–H indicate distance of expression in the tail. Arrowheads in F, H, L indicate regions of increased or ectopic expression.