
|
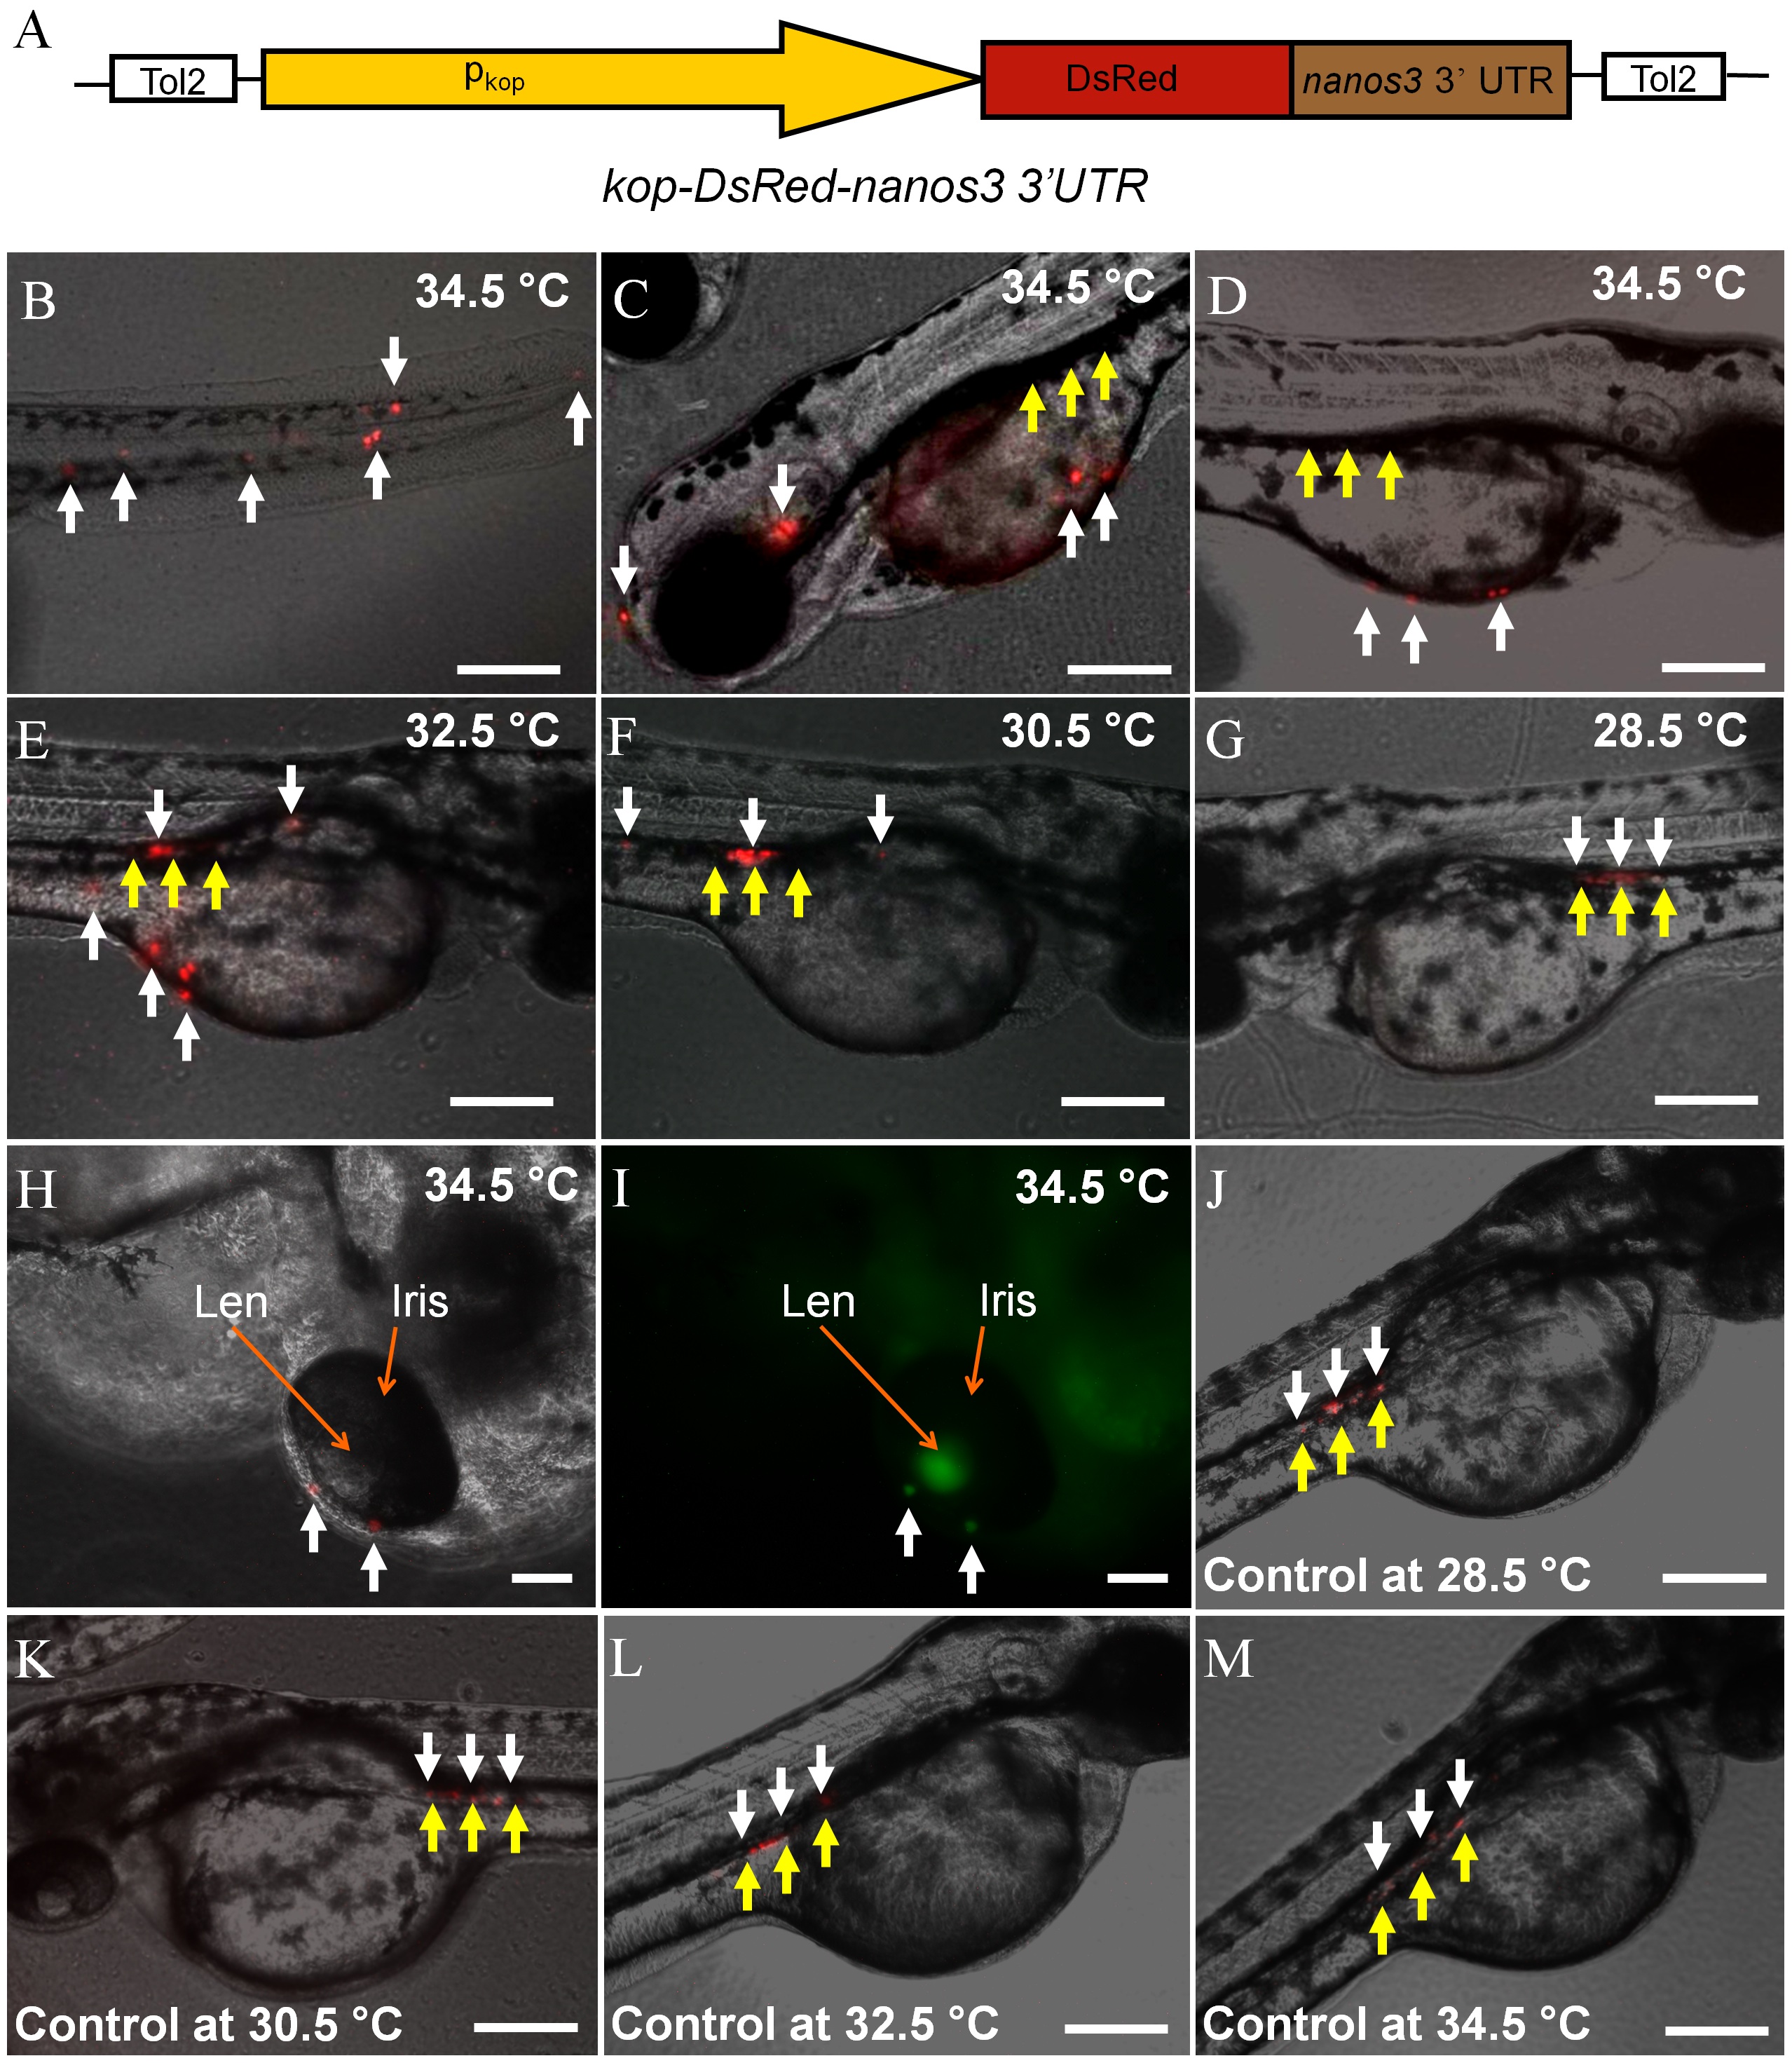
Fig. 3
Disruption of PGC migration in heat-treated Tg(hsp70:sdf1a-nanos3, EGFP)/Tg(kop:DsRed-nanos3) embryos.
(A) Diagram of the plasmid construct used to generate the Tg(kop:DsRed-nanos3) zebrafish. A 3.8 kb fragment of the zebrafish kop promoter and nanos3 3?UTR control PGC-specific DsRed expression. (B–E) Photomicrographs showing PGC migration in heat-treated Tg(hsp70:sdf1a-nanos3, EGFP)/Tg(kop:DsRed-nanos3) embryos. In embryos treated at 34.5°C at 2dpf the majority of ectopically located PGCs were observed in (B) the tail, (C) the head and (D) along the outer surface of the yolk sac. (E) Fewer ectopic PGCs were observed in the embryos treated at 32.5°C and (F, G) at 30.5 and 28.5°C the majority of PGCs migrated to the gonadal region. (H, I) Mis-migrated PGCs (red) also express EGFP. (J–M) No significant disruption of PGC migration was found when embryos of Tg(kop:DsRed-nanos3) were heat-treated at temperatures ranging from 28.5 to 34.5°C for 18 hours. White arrows: DsRed-expressing PGCs; yellow arrows: gonadal region. Scale bar = 200 μm.