
|
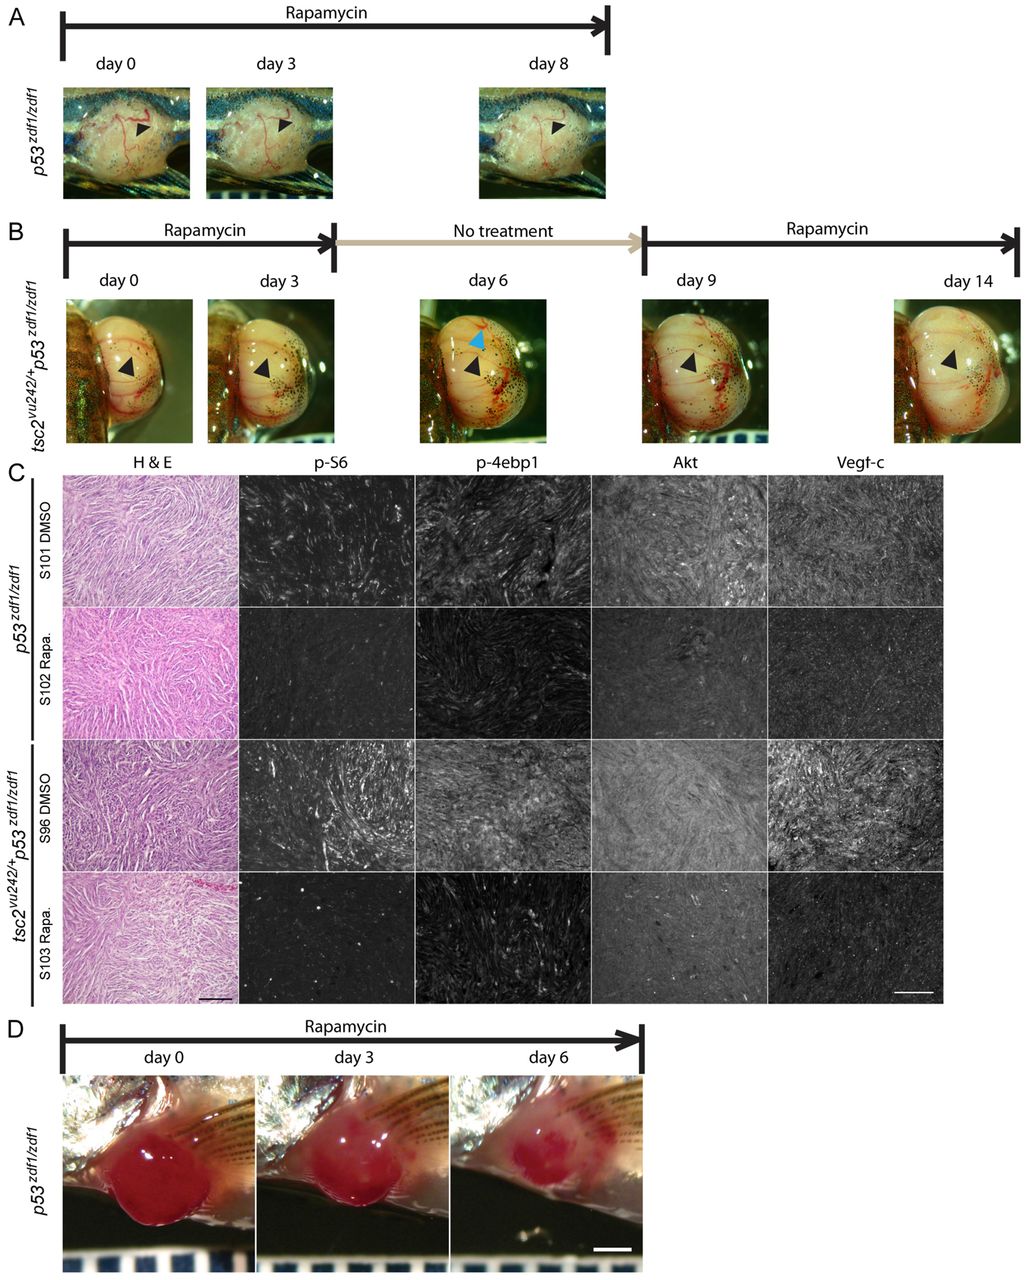
Fig. 6
Rapamycin treatment reduced blood vessel caliber in tumors from p53zdf1/zdf1 and tsc2;p53 compound mutant zebrafish. (A,B) Representative tumors from rapamycin-treated fish. (A) Rapamycin treatment of p53zdf1/zdf1 zebrafish harboring a tumor in its trunk. Arrowheads indicate visible vascular structure on the tumor surface. (B) Rapamycin treatment cycle (on day 0 to 3, 9 to 14, off day 4 to 8) lasting 2 weeks in a compound mutant zebrafish with an expending eye tumor. Pictures were taken at indicated days. Black arrowheads indicate vascular structures that disappeared during rapamycin treatment. Blue arrowhead indicates apparent new vessels formed during the rapamycin-off period. (C) H&E staining, and phospho-S6, phospho-4EBP1, Akt and Vegf-c expression (antibody signal shown as white) in p53zdf1/zdf1 and tsc2;p53 compound mutant abdomen tumors treated with DMSO or rapamycin for 2 days (n=3). Scale bar: 100 μm. (D) Rapamycin shrinks tumors in p53zdf1/zdf1 zebrafish. A representative angioma-like tumor was seen near the pectoral fin and treated daily with rapamycin. After 3 days of treatment, a clear decrease in size was noted. The tumor continued to shrink over the 1 week total period of rapamycin treatment. Scale bar: 1 mm.