
|
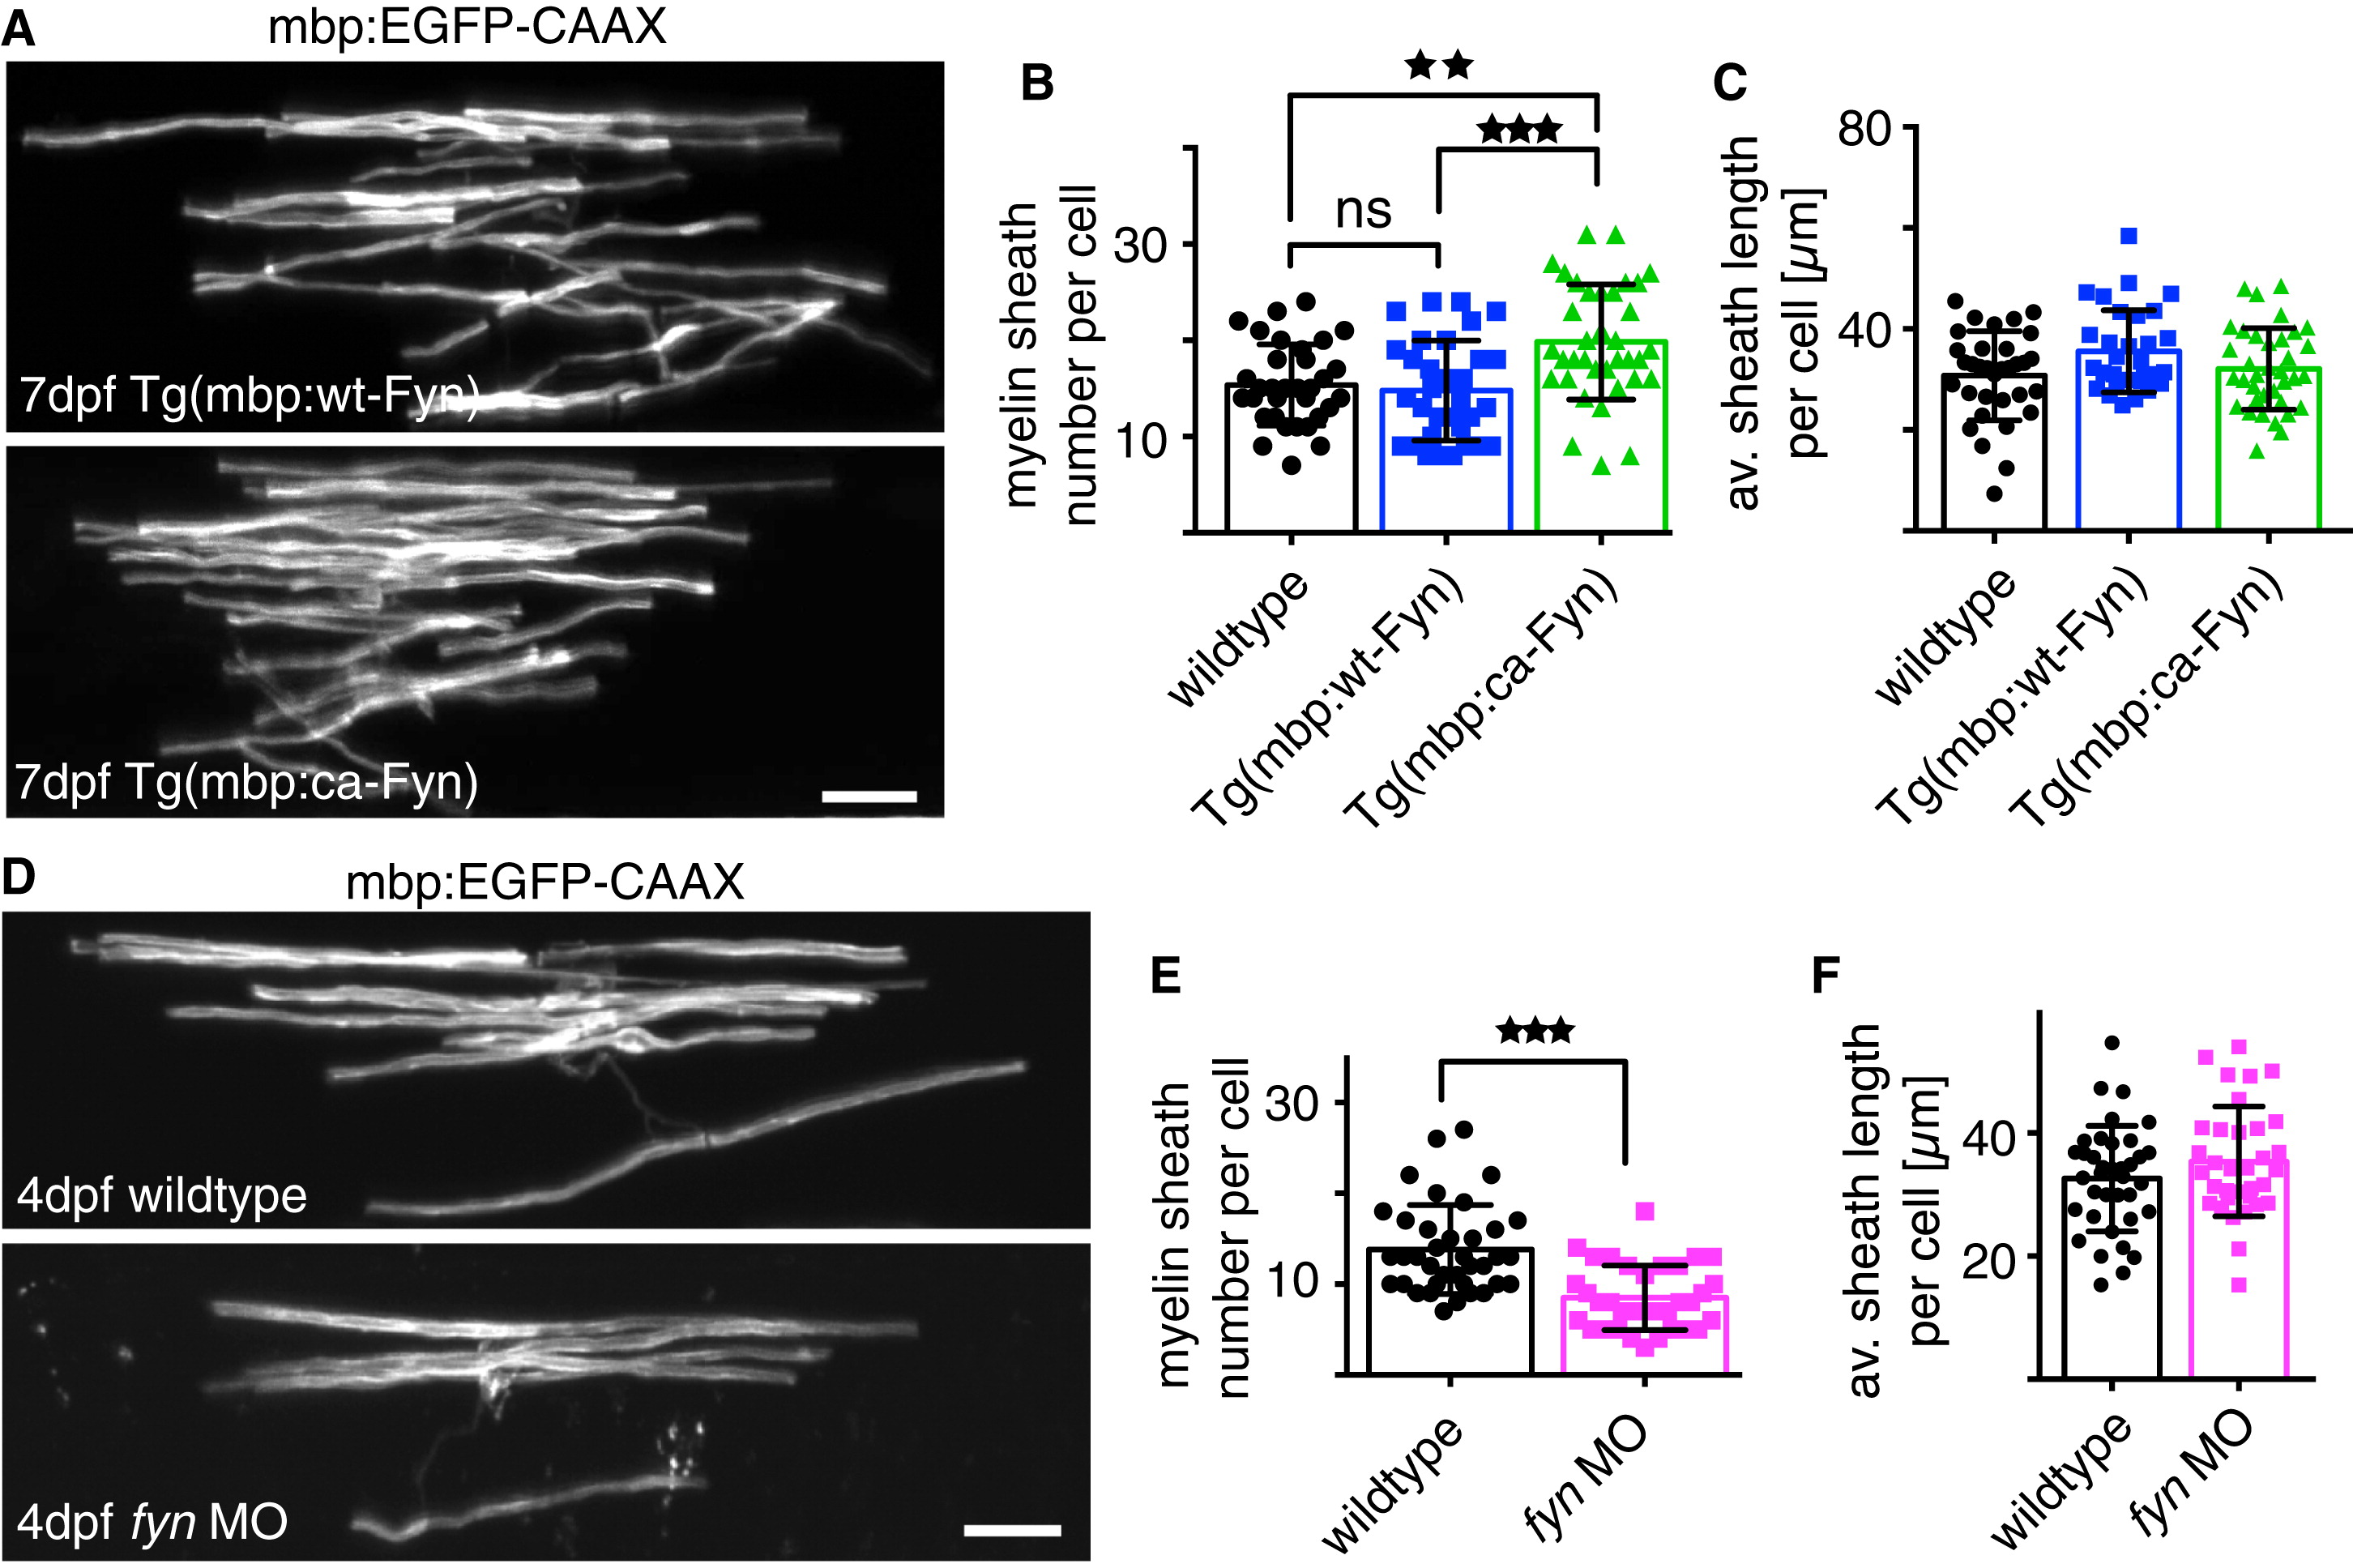
Fig. 4
Manipulation of Fyn Alters Myelin Sheath Number per Oligodendrocyte (A) mbp:EGFP-CAAX-expressing oligodendrocytes at 7 dpf in Tg(mbp:wt-Fyn) (top) and Tg(mbp:ca-Fyn) animals (bottom). Scale bar, 10 μm. (B) Oligodendrocytes in Tg(mbp:ca-Fyn) animals have a higher number of myelin sheaths than control or those in Tg(mbp:wt-Fyn) animals. Significance was assessed using one-way ANOVA. Error bars indicate SD. (C) The average length of myelin sheath per cell is not significantly different between control, Tg(mbp:wt-Fyn), or Tg(mbp:ca-Fyn) animals. Significance was assessed using one-way ANOVA. Error bars indicate SD. (D) mbp:EGFP-CAAX-expressing oligodendrocytes in control (top) and fyn morphant (bottom). Scale bar, 10 μm. (E) fyn morphants have a reduction in myelin sheath number per cell compared to control. Significance was assessed using Student’s two-tailed unpaired t test. Error bars indicate SD. (F) The average length of myelin sheaths per cell does not change following Fyn loss-of-function. Significance was assessed using Student’s two-tailed unpaired t test. Error bars indicate SD. See also Figures S1 and S2.
Reprinted from Developmental Cell, 25(6), Czopka, T., Ffrench-Constant, C., and Lyons, D.A., Individual Oligodendrocytes Have Only a Few Hours in which to Generate New Myelin Sheaths In Vivo, 599-609, Copyright (2013) with permission from Elsevier. Full text @ Dev. Cell