
|
Fig. 2
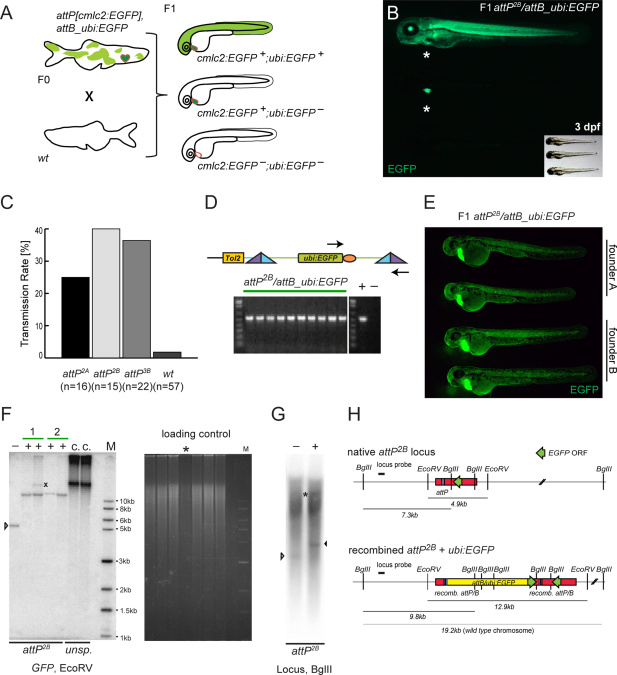
Germline integration and transgene transmission. A: Theoretical experimental outcome. Upon successful attP/attB recombination in the germline, outcrossing of attP, cmlc2:EGFP- and attB_ubi:EGFP-positive F0 adults to wt results in 50% wt and 50% cmlc2:EGFP-positive landing site carriers in the F1, with a fraction of additionally ubi:EGFP-positive embryos. B: Observed experimental outcome as outlined in A. Small inset shows through-light overlay to reveal the GFP-negative animal. C: Obtained transmission rates, ranging from 25% for attP2A to 40% for attP2B and 36% for attP3B, compared to 2% background transmission in the wt control. D: In individual double-positive F1 embryos, faithful attP/attB recombination was tested by PCR with primers indicated as arrows and subsequent agarose gel electrophoresis; the gel depicts PCR results from 10 individual attP2B/attB_ubi:EGFP embryos, including positive and negative control lanes. E: EGFP fluorescence microscopy of 48-hpf embryos showing stable attP/attB transgenic F1 with comparable attB_ubi:EGFP-expression in each clutch as well as across clutches from two different founders (founder A and B), indicative of a single integration. F: Southern blot analysis of attP2B with recombined ubi:EGFP probed for EGFP after EcoRV digest. Minus lanes depict uninjected, native attP2B; plus lanes are ubi:EGFP-positive F1 zebrafish; numbers mark independent founders; the X marks untargeted GPF debris fragment, while the last two lanes show non-targeted concatemeric (c.) insertions from unspecific (unsp.) founders as reference. The ethidium bromide fluorescence shows the gel in F before transfer; the asterisk marks sample “Founder 2, fish 1” with less DNA input relative to the other lanes; M indicates the DNA marker lane. G: Southern blot analysis attP2B with recombined ubi:EGFP probed for the genomic locus (digested with BglII); the white arrowhead indicates the native attP site band, the black arrowhead marks the size shift upon ubi:EGFP integration; also note the longer endogenous locus band (asterisks) as probed zebrafish were heterozygous for the transgenes, and high background due to repetitive elements in the probed genomic locus (see also Experimental Procedures section for details). H: Schematic of attP2B genomic locus before and after ubi:EGFP integration, the distribution of the EcoRV and BglII restriction sites, and the locus-specific Southern probe. Green arrows indicate EGFP coding sequences and their respective orientation, the yellow bar shows the integrated ubi:EGFP vector.