
|
Fig. 2
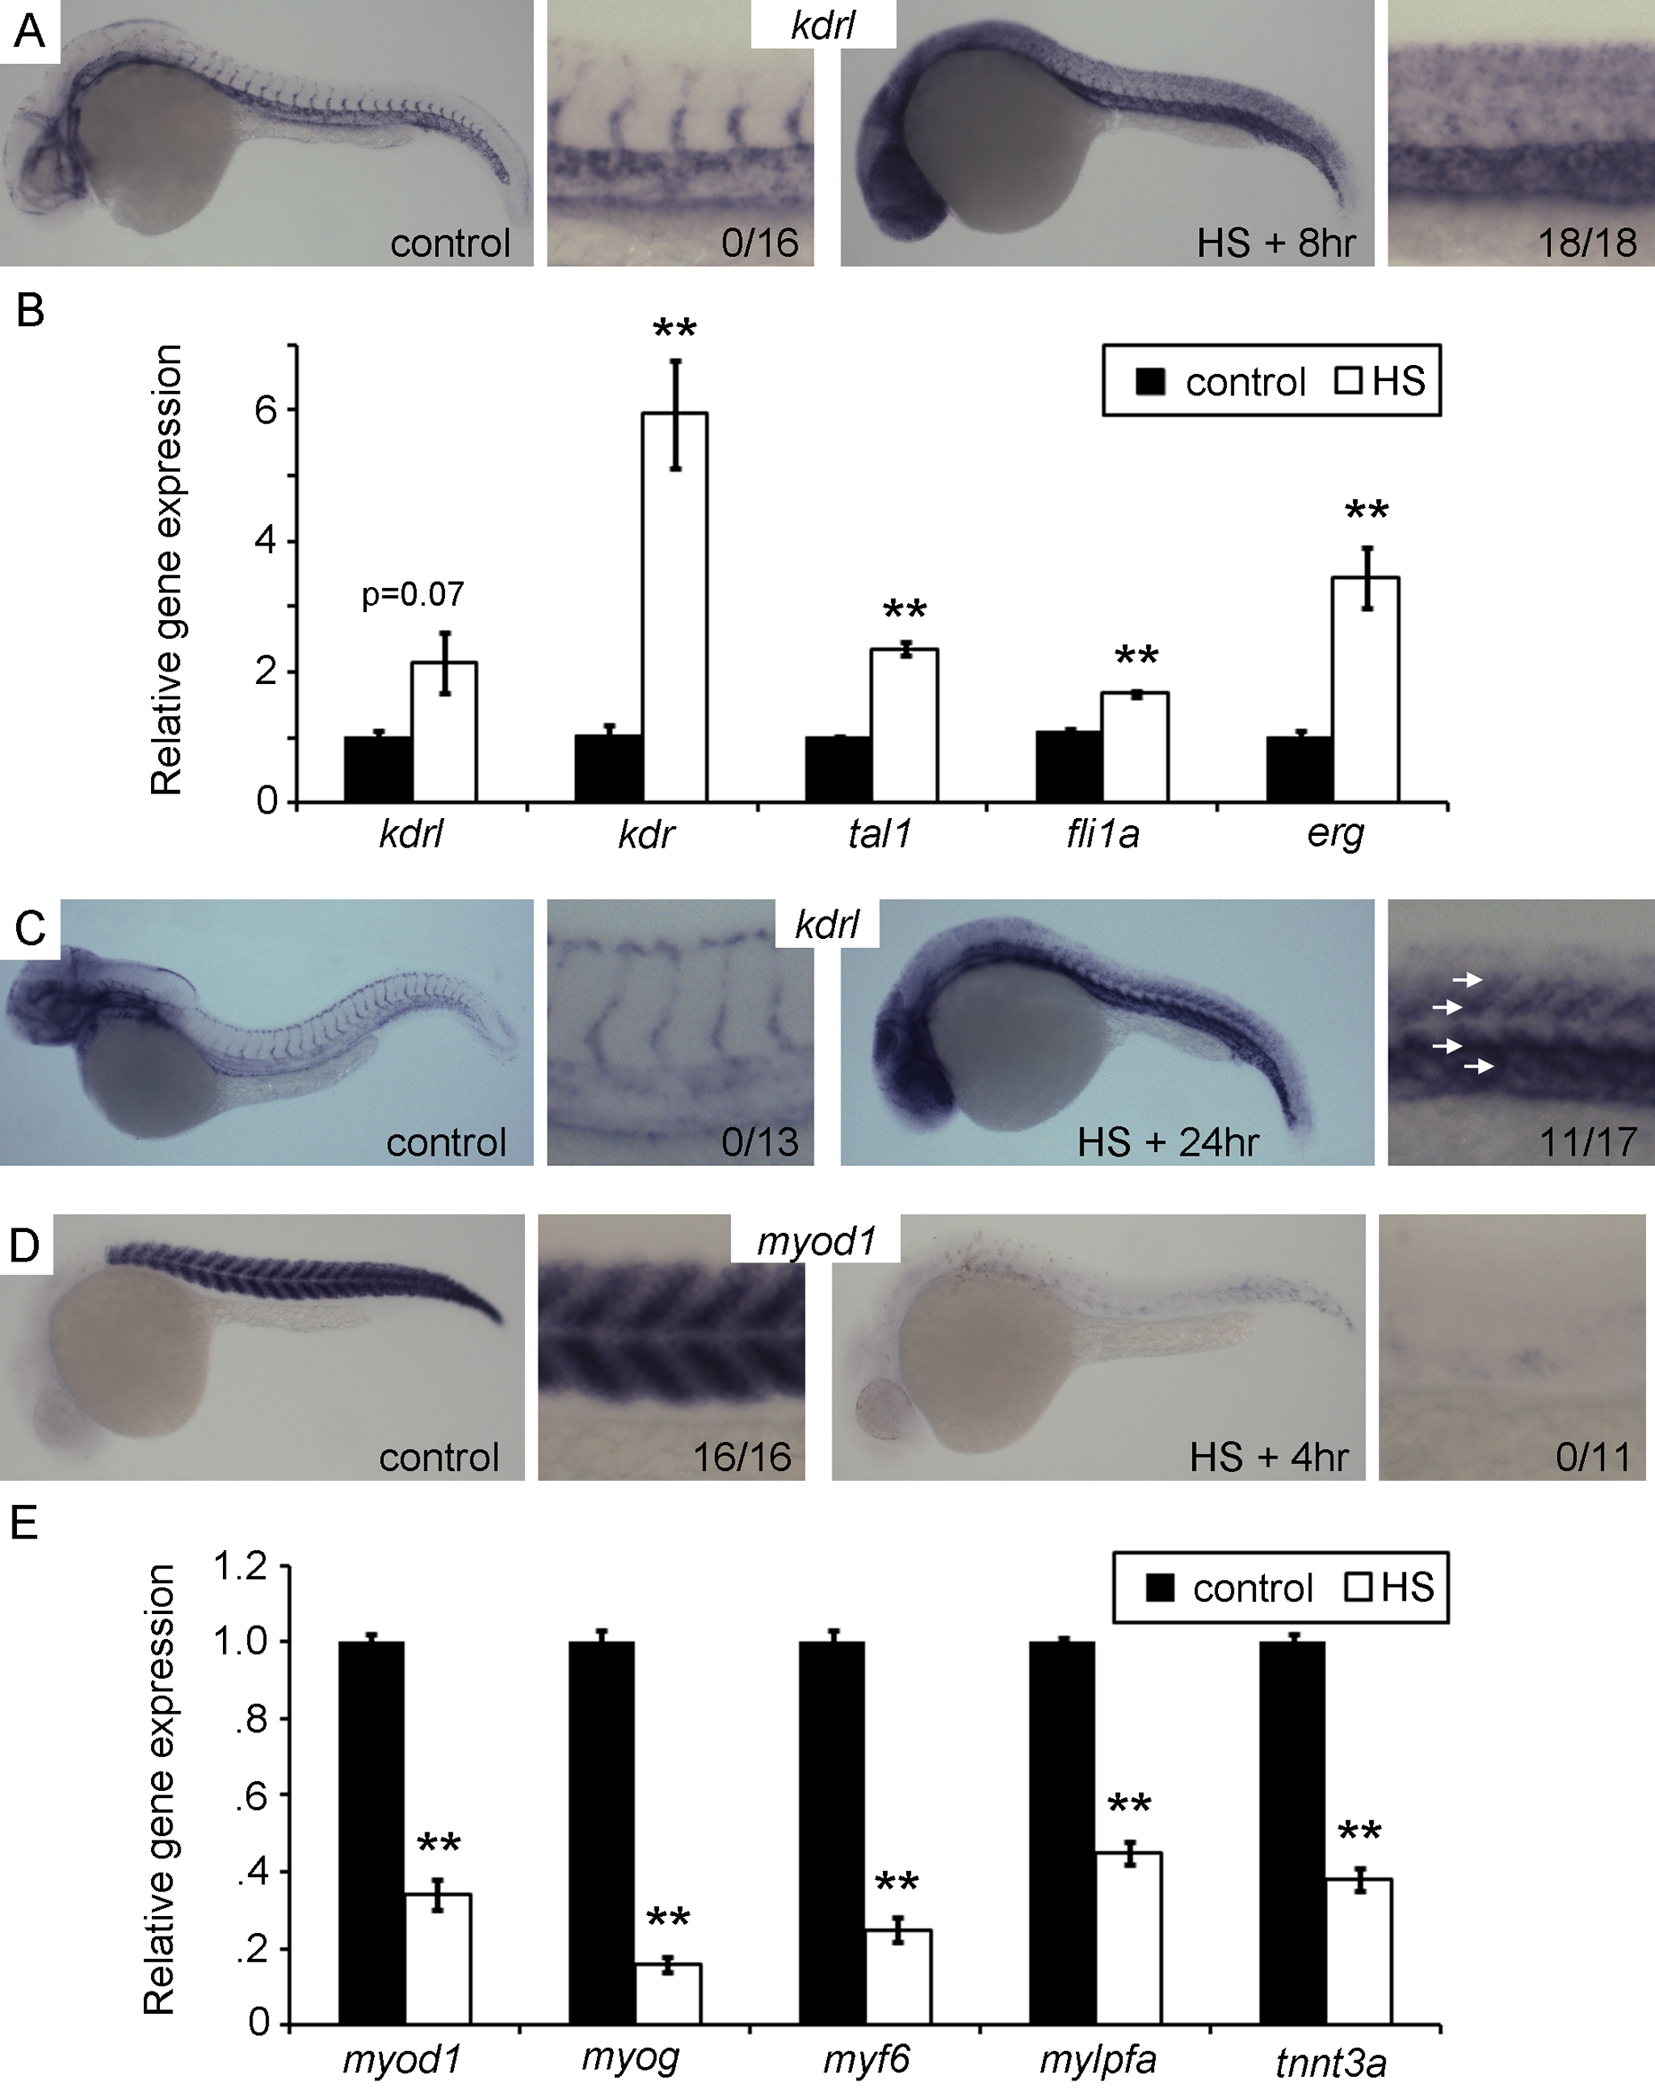
Etv2 overexpression induces vascular gene expression and represses muscle gene expression.
(A and B) Vascular genes are induced 8 h post-HS. (A) In situ hybridization (ISH) for kdrl demonstrates broad ectopic expression including in the trunk following HS, but normal vascular restricted expression in control embryos. The numbers in the higher magnification views represent the number of embryos exhibiting ectopic expression over the number observed. (B) Quantitiative RT-PCR (qPCR) for kdrl, kdr, tal1, fli1a, and erg 8 h post-HS versus non–heat shocked controls. (C) ISH for kdrl at 24 h post-HS demonstrates increase expression in the trunk (white arrows). The apparent age discrepancy between the control and the HS+24 h embryo is due to developmental delay caused by Etv2 overexpression. (D and E) Muscle genes are repressed by Etv2 overexpression. (D) ISH for myod1 demonstrating near complete loss of expression 4 h post-HS. The numbers in the higher magnification views represent the number of embryos exhibiting normal expression levels. (E) qPCR for muscle genes myod1, myog, myf6, mylpfa, and tnnt3a shows significantly decreased expression 4 h post–heat shock. qPCR was performed on three separate clutches. (**) p<0.01, t test versus non–heat shocked control.