
|
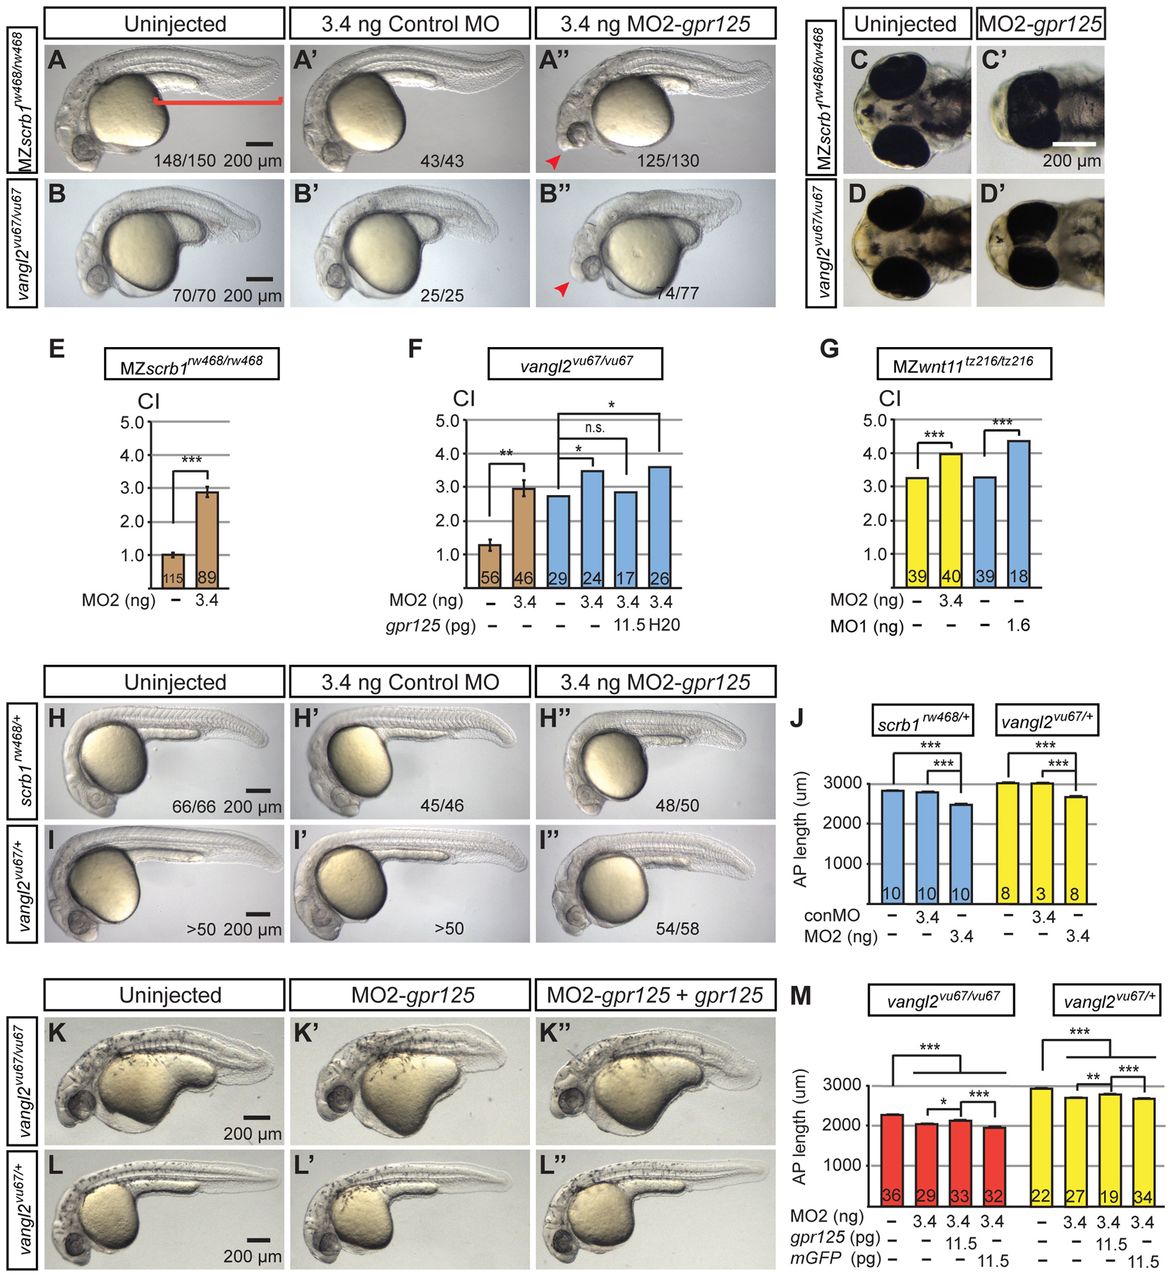
Fig. 2 Knockdown of gpr125 enhances defects of scrbl1/llk and vangl2/tri mutants. (A-B2) Lateral views of uninjected, control MO- or MO2-gpr125-injected MZscrb1/llkrw468/rw468 or vangl2/trivu67/vu67 homozygotes at 1 dpf. Anterior is leftwards. The bracket in A marks the posterior body. Arrowheads in A and B′ indicate the cyclopic eyes and change of head position. Fractions of affecte′d embryos are indicated. (C-D′) Ventral views of uninjected or 3.4 ng MO2-gpr125-injected MZscrb1/llkrw468/rw468 or vangl2/trivu67/vu67 embryos at 3 dpf. Anterior is leftwards. (E-G) Quantification of CI of MZscrb1/llkrw468/rw468, vangl2/trivu67/vu67 and MZwnt11/slbtz216/tz216 embryos at 3 dpf injected with gpr125 MOs and/or RNA or water. The numbers of analyzed embryos are inside the bars. Brown bars represent results from three independent experiments with error bars indicating s.e.m. Yellow and blue bars show results from single experiments with results of additional repetitions shown in supplementary material Tables S2 and S3. *P<0.05, **P<0.01, ***P<0.001. (H-I′) Lateral views of uninjected, 3.4 ng control MO injected or 3.4 ng MO2-gpr125-injected MZscrb1/llkrw468/+ or vangl2/trivu67/+ heterozygotes at 1 dpf. Anterior is leftwards. Fractions of affected embryos are indicated, except for I and I2, where more than 50 embryos were analyzed. (J) Quantification of AP axis length in scrb1/llkrw468/+ and vangl2/trivu67/+ embryos at 1 dpf. The numbers of analyzed embryos are inside the bars. Error bars indicate ±s.e.m. ***P<0.001. (K-L2) Lateral views of uninjected, 3.4 ng MO2-gpr125, or 3.4 ng MO2-gpr125 and 11.5 pg gpr125 RNA co-injected vangl2/trivu67/vu67 or vangl2/trivu67/+ embryos at 1 dpf. Anterior is leftwards. (M) Quantification of the impacts of gpr125 MO and RNA on the AP axis defects of vangl2/trivu67/vu67 vangl2/trivu67/+ embryos at 1 dpf. The numbers of analyzed embryos are inside the bars. Error bars indicate ±s.e.m. *P<0.05, **P<0.01, ***P<0.001.