
|
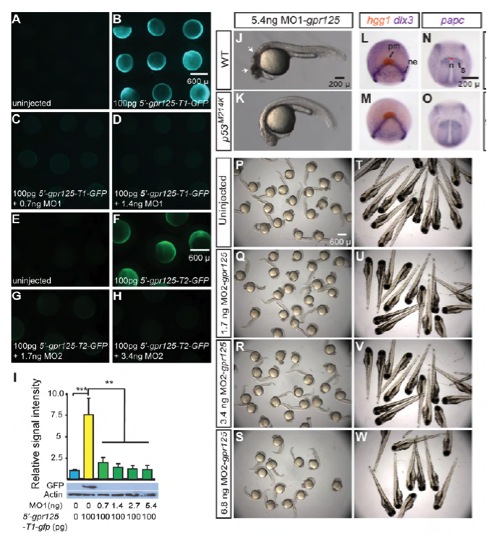
Fig. S2 Effective gpr125 MOs cause no noticeable morphological defects in wild-type embryos. (A-D) Live images of uninjected (A), 100 pg 5′-gpr125-T1-GFP RNA (GFP reporter for MO1-gpr125) injected (B), or 100 pg 5′-gpr125-T1-GFP RNA and MO1- gpr125 co-injected embryos (C,D) at the 70%-epiboly stage. (E-H) Live images of uninjected (E), 100 pg 5′-gpr125-T2-GFP RNA (GFP reporter for MO2-gpr125) injected (F), or 100 pg 5′-gpr125-T2-GFP RNA and MO2-gpr125 co-injected embryos (G-H) at the 75% epiboly stage. (I) Western blot quantification of GFP reporter protein levels in MO1-gpr125 injected embryos. The density of the GFP bands was normalized to that of the actin bands and the signal intensity relative to uninjected embryos is shown. Error bars indicate s.e.m. **P<0.01, ***P<0.001. (J,K) Lateral views of 5.4 ng MO1-gpr125-injected wild-type (J) or p53M214K/M214K embryos (K) at 1 dpf. Anterior is leftwards. Arrows in J indicate regions of significant cell death. (L-O) Whole-mount in situ hybridization analyses of marker gene expression in uninjected (L,N) and 2.7 ng MO1-gpr125-injected embryos (M,O) at the two-somite stage. (L,M) Animal pole views, ventral is upwards. (N,O) Dorsal views, anterior is upwards. n, notochord; ne, neural ectoderm border; pm, prechordal mesoderm; s, somites. Red line in N indicates the width of the notochord at the first somites. (P-W) Uninjected embryos or embryos injected with increasing doses of MO2-gpr125 at 1 dpf or 3 dpf.